Fig. 3.
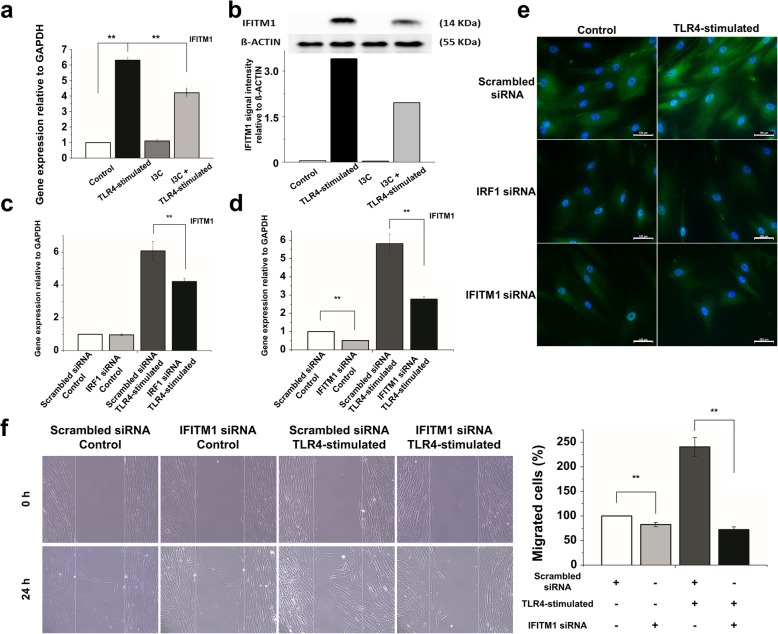
IFITM1 regulation in cell migration responses. a Effect of I3C on IFITM1 mRNA expression in TLR4-stimulated hMSCs measured by quantitative real-time PCR. Gene expression was normalized to GAPDH transcript levels. The data represent three independent experiments. **P < 0.005. b Effect of I3C on IFITM1 protein expression in TLR4-stimulated hMSCs measured by western blotting. Protein expression was normalized to β-ACTIN expression level. c, d Quantitative real-time PCR analysis of IFITM1 mRNA in IRF1 siRNA-treated hMSCs and IFITM1 siRNA-treated cells. Gene expression was normalized to GAPDH transcript levels. **P < 0.005. e Effect of knockdown of IRF1 and IFITM1 on the IFITM1 expression in TLR4-stimulated hMSCs assessed by immunofluorescence microscopy. Original magnification, × 400. f The migration of hMSCs was determined using a wound healing migration assay. Representative images of migrating hMSCs after 24 h in TLR4-stimulated or IFITM1 siRNA-treated hMSCs are shown on the left. On the right, the numbers of cells (%) migrated into the middle blank fields after 24 h of incubation are shown. There was a significant difference between the TLR4-stimulated and IFITM1 siRNA-treated hMSCs in the wound healing migration assay when compared with the TLR4-stimulated hMSCs (**P < 0.005)

