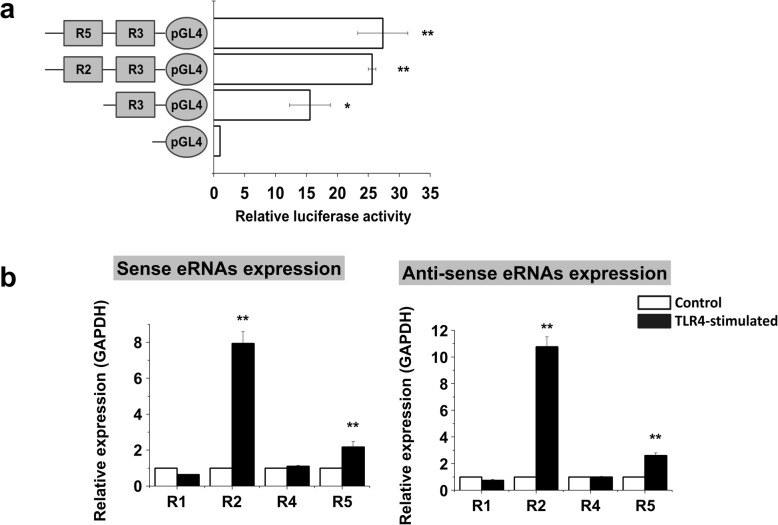
Fig. 5.
Characterization of IFITM1 enhancer regions. a Relative luciferase reporter activities driven by IFITM1 enhancer and promoter regions (unstimulated cells). Data are normalized to the pGL4.17 construct. The data represent three independent experiments. **P < 0.005. b Quantitative real-time PCR analysis of sense (a) and anti-sense (b) eRNA levels of IFITM1 enhancer regions. Expression was normalized to GAPDH transcript levels. The data represent three independent experiments. **P < 0.005

