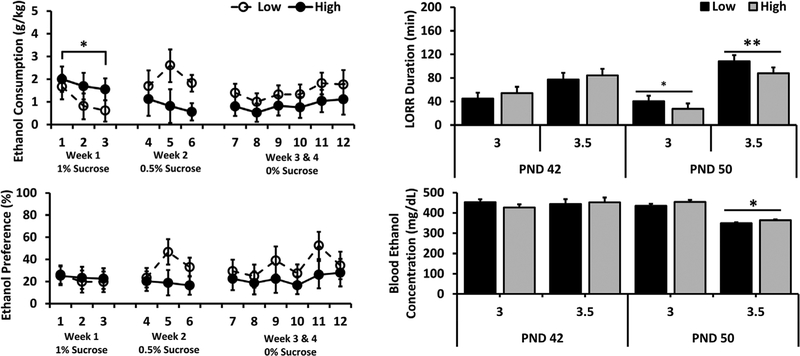
FIGURE 1.
Adolescent High- and Low-LG female 5% ethanol consumption (top left), 5% ethanol preference (bottom left), acute 3.0 or 3.5 g/kg ethanol induced LORR duration (top right), and blood ethanol concentration at awakening (bottom right). Data displayed as group Mean ± S.E.M. (*p < 0.05; **p < 0.01) (n = 8/group for ethanol consumption and preference; n = 8–12/group for LORR)

