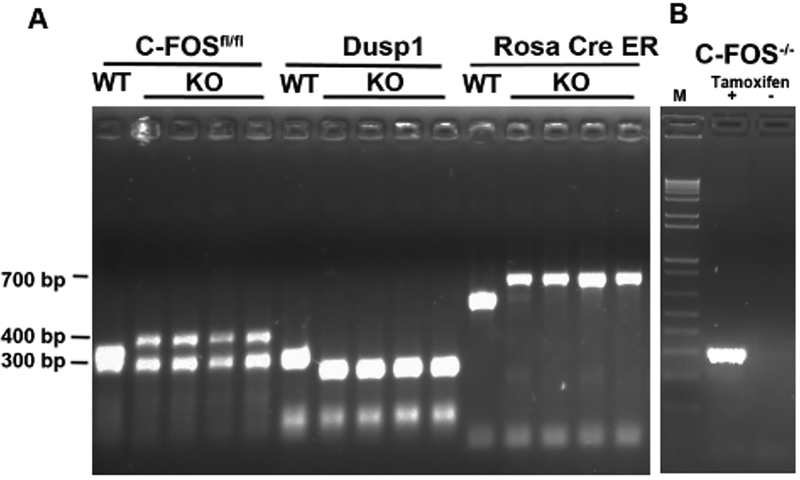
Figure 2: Genotyping of c-Fosfl/flDusp1 and Rosa cre-ER mice.
(A) PCR analysis of tail DNA. Expected bands are from WT or from the c-Fosfl/fl-carrying CreER transgene and Dusp1 KO mice. The band sizes are indicated on the left. (B) PCR analysis of a smaller band after the deletion of c-Fos with tamoxifen treatment. M = 1 kb+ DNA Ladder.

