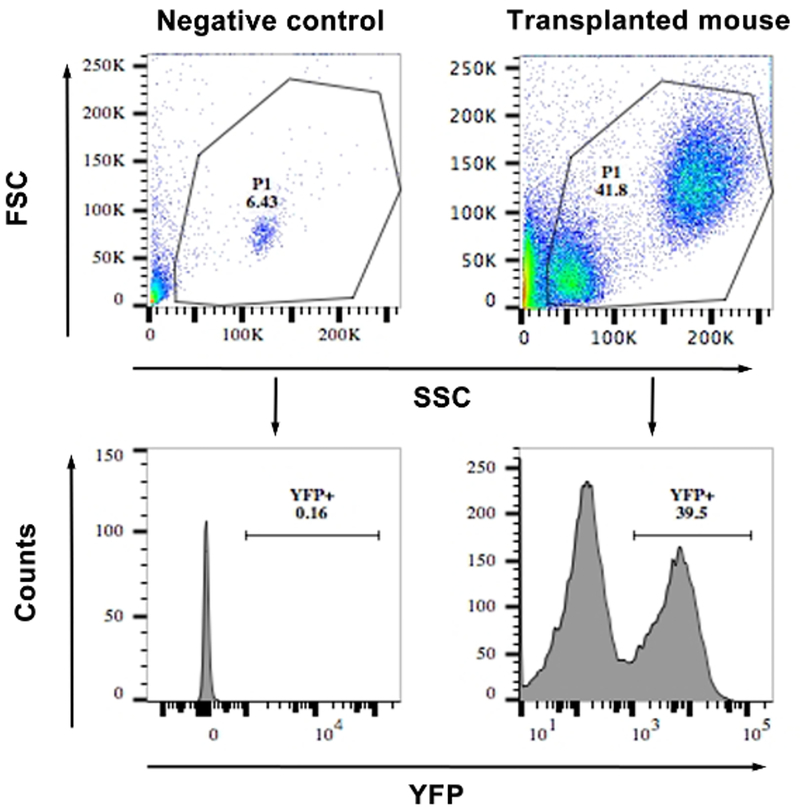
Figure 4: FACS showing the frequency of YFP+ cells from the blood of a transplanted and a WT mouse (negative control).
The top panels show a scatter plot of the cells and the gating. The lower panels show histograms of YFP vs. side scatter. Cells with an MFI of >103 were considered YFP+. Similar gating was used for bone marrow cells after transduction for calculating the percentage transduction.

