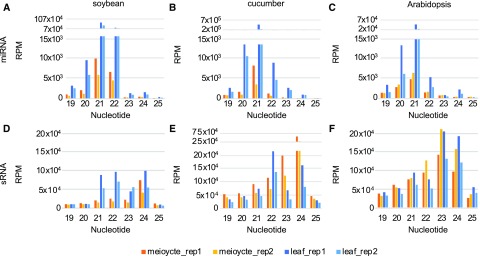
Figure 1.
Size distribution of miRNAs and filtered sRNAs in soybean, cucumber, and Arabidopsis. A, Mappable miRNA size (19–25-nt) distribution from soybean. Each sample has two biological replicates. sRNA abundance was normalized in RPMs. B, Size distribution of mappable miRNAs from cucumber. C, Size distribution of mappable miRNAs from Arabidopsis (Huang et al., 2019). D, Size distribution of mappable sRNAs after filtering annotated sRNA from soybean. E, Size distribution of mappable sRNAs after filtering annotated sRNA from cucumber. F, Size distribution of mappable sRNAs after filtering annotated sRNA from Arabidopsis.

