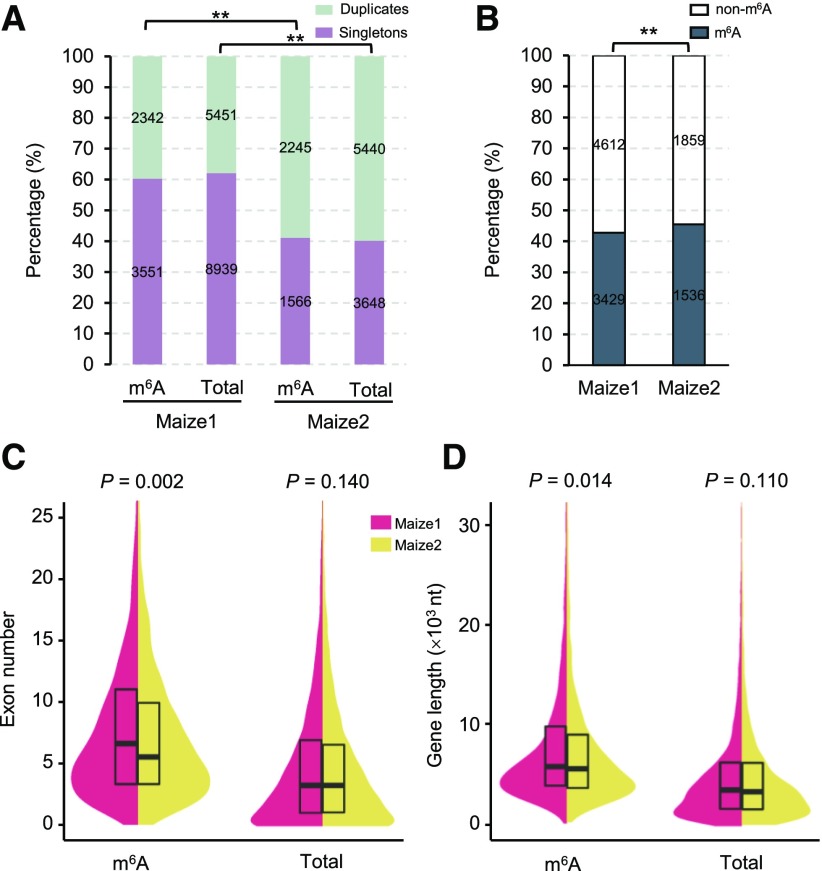
Figure 3.
Evolutionary influences on RNA m6A methylome bias between two maize subgenomes. A, Comparison of singleton-duplication ratio of m6A genes and total subgenome genes in maize1 and maize2. Statistical analysis was conducted using the χ2 test. **P < 0.001. B, Comparison of m6A gene frequency in maize1 singletons and maize2 singletons. Statistical analysis was conducted using the χ2 test. **P < 0.001. C, D, Comparison of exon number and gene length of m6A singletons in maize1 and maize2. Statistical analysis was conducted using Student’s t test.

