Figure 1.
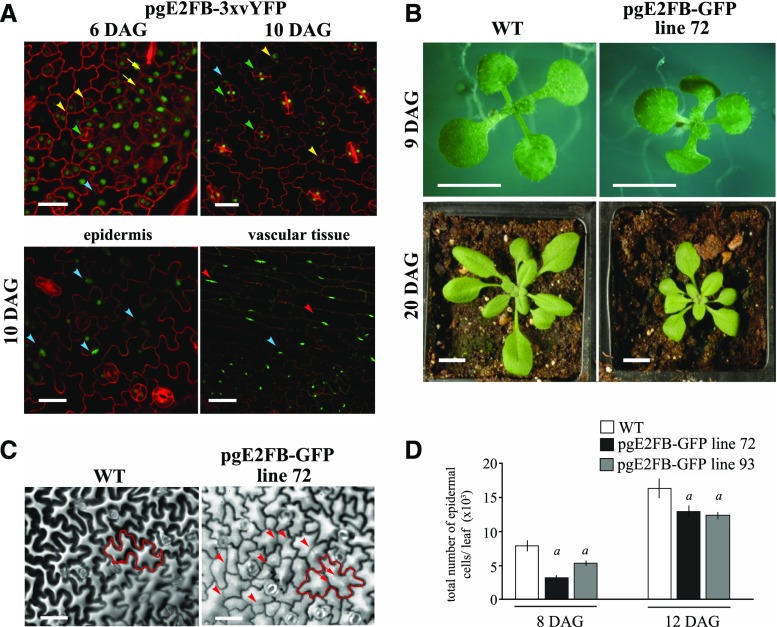
Elevated E2FB level in its own expression domain inhibits cell proliferation in young leaves and disturbs quiescence in older leaves. A, Representative confocal laser scanning microscopy images of the abaxial leaf surface from the first leaf pair of the transgenic line pgE2FB-3×vYFP at 6 and 10 DAG (top), and localization in the epidermis and vascular tissues of the same transgenic line at 10 DAG (bottom). The YFP signal (green) is counterstained for cell membrane with PI (red). Yellow arrows point toward dividing protodermal cells, yellow arrowheads indicate stomatal meristemoids, green arrowheads label fully developed stomata guard cells, blue arrowheads mark elongated pavement cells, and red arrowheads show elongated vascular cells with GFP signal in their nucleus. Scale bars = 20 μm (top) and 25 μm (bottom). B, Images of the wild type (WT) and the transgenic line with high E2FB expression (pgE2FB-GFP line 72) grown for 9 DAG in vitro and for 20 DAG on soil. Scale bars = 0.5 cm. C, Representative images of the abaxial epidermal cell layer of the first leaf pair from wild-type and pgE2FB-GFP line 72 seedlings (12 DAG) taken by differential interference contrast microscopy, for which the imprints were made by the gel casting method. An example of an elongated puzzle-formed pavement cell is outlined in red (left). Arrows indicate straight cell walls inside the cell, whereas arrowheads mark newly formed cell walls inside the elongated pavement cells. Scale bars = 20 μm. D, Quantification of the total number of epidermal cells from the first leaf pair of the wild type and two pgE2FB-GFP transgenic lines (lines 72 and 93). Values represent means and error bars indicate the sd. Significance was determined by Student’s t test; a, P < 0.05. n = 3 and n > 600. The quantifications of cellular parameters are summarized in Supplemental Tables S1 and S2 from 8 and 12 DAG leaves, respectively. Data information, n = biological repeat, n = samples per biological repeat, here and in following figure legends.

