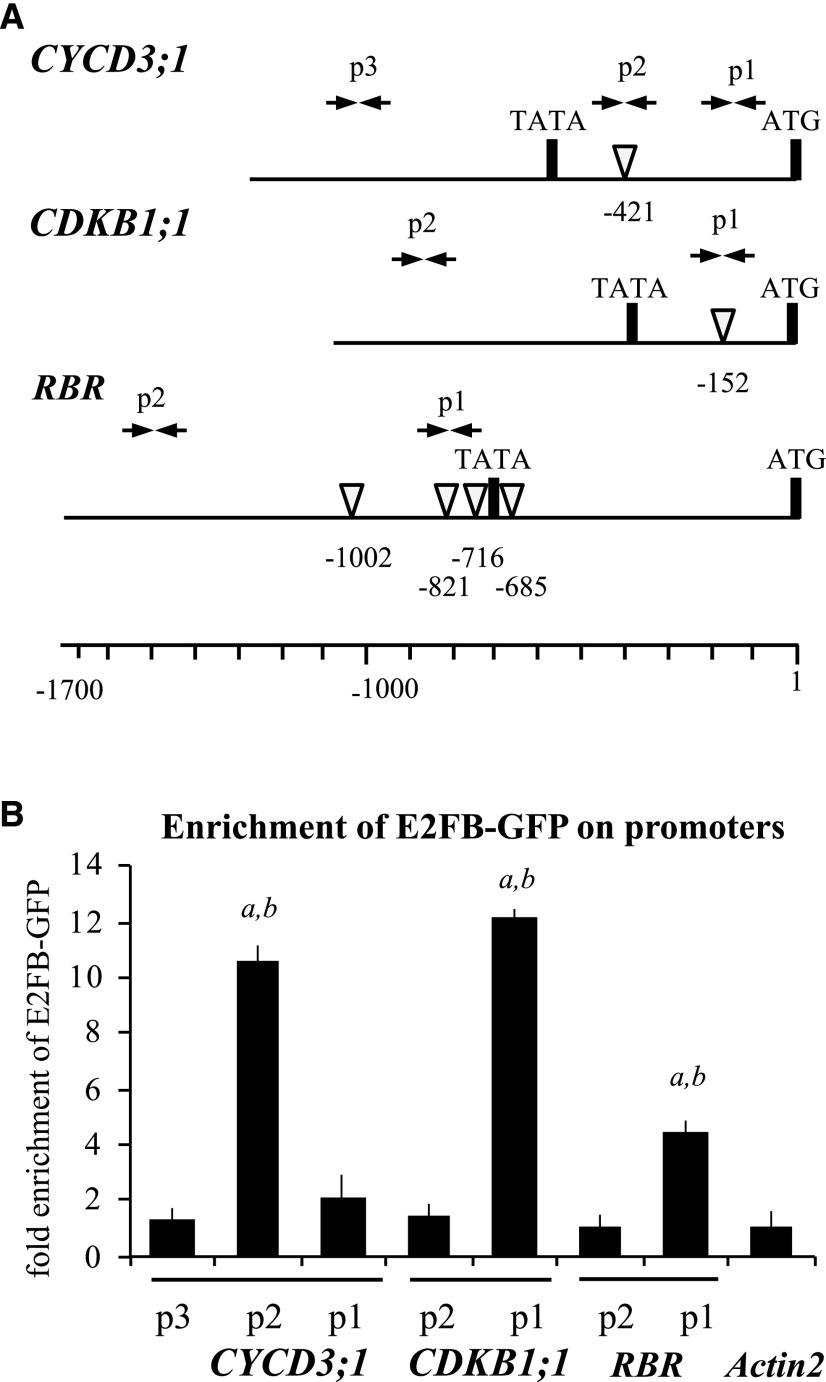
Figure 4.
E2FB directly binds to CYCD3;1, CDKB1;1, and RBR promoters. A, Schematic representation of the CYCD3;1, CDKB1;1, and RBR promoters; arrow pairs labeled p1, p2, and p3 indicate the positions of the primer pairs used for qPCR analysis. The position of the canonical E2F elements (white arrowheads) and their distance from the start codon (ATG) are depicted. Primer sequences are listed in Supplemental Table S3. B, ChIP followed by qPCR was carried out on chromatin isolated from complemented e2fb-2 E2FB-GFP seedlings (7 DAG) using polyclonal antirabbit GFP antibody; the graph shows fold enrichment calculated as the ratio of chromatin bound to the numbered section of the CYCD3;1, CDKB1;1, and RBR promoters with or without antibody. Shown is a representative experiment with three biological replicates. a and b, P < 0.01, statistically significant enrichment between the relevant fragment and the neighboring fragments (a) and between the relevant regulatory region and the negative control (Actin2; b) determined by Student’s t test. The values represent the means of three technical replicates. Error bars indicate the sd. The enrichment on the Actin2 promoter was arbitrarily set to 1. The labels p1, p2, and p3 on the x axis refer to the regions indicated in A.

