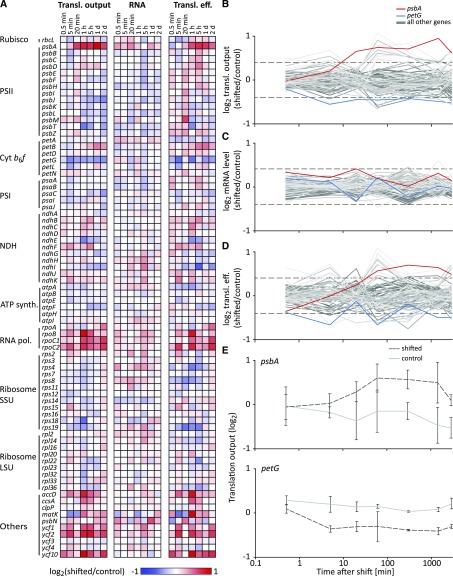
Figure 2.
Dynamics in chloroplast translation during acclimation to high light. A, Heat maps representing the average log2-transformed relative translational (Transl.) output and transcript level (RNA) of high light-shifted tobacco plants compared to control tobacco plants (n = 3), and the resulting relative translation efficiency (Transl. eff.; relative ribosome footprint levels normalized to relative transcript abundances) for each plastid gene (labeled on the left) for the analyzed time points after the light shift (indicated on top of the heat maps). Increased and decreased relative expression levels of shifted plants compared to control plants are represented by red and blue colors, respectively (as indicated in the legend below the heat maps; note the limited scale used to visualize the maximum ∼2-fold changes). Genes are grouped in the functional categories PSII, Cyt b6f, PSI, NDH (NADH dehydrogenase-like complex), ATP synth. (ATP synthase), RNA pol. (RNA polymerase), Ribosome SSU (ribosome small subunit), Ribosome LSU (ribosome large subunit), and Others. B to D, Line plots of the log2-transformed relative translational output (B), transcript level (C), and translation efficiency (D) for all chloroplast genes during high light acclimation. psbA and petG, whose translational output is mildly but consistently (i.e. reproducible >1.3-fold change for two or more consecutive time points) up- and downregulated are plotted in red and blue, respectively, to mark the most consistent changes in translational output (for details, see “Results”). All other genes are plotted in different shades of gray. Note the logarithmic scale of the x axis. Individual scatter plot diagrams for each single time point after high light shift are shown in Supplemental Figure S6. E, Representative line plots of log2-transformed relative abundances of ribosome footprint levels of psbA and petG in shifted and control (dark gray dotted and light gray solid lines, respectively) tobacco plants for the analyzed time points, represented as average values for three biological replicates (vertical error bars indicate standard deviations). Note the logarithmic scale of the x axis.

