Figure 4.
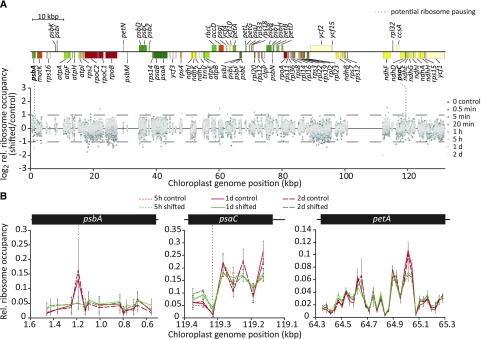
Chloroplast translation elongation is not substantially affected by increased light intensity. A, Quantitative plastome-wide comparison of relative ribosome occupancies within RFs between shifted (1,000 µmol m−2 s−1) and control (350 µmol m−2 s−1) conditions in tobacco. For each probe in protein-coding regions, ribosome footprint signal intensity was normalized to the sum of the signal intensities of all probes in the respective RF for high light-shifted and control samples. Ratios of these relative ribosome occupancy values were calculated for three biological replicates, and their averages were plotted for the indicated time points (different shades of gray as indicated in the legend) against the position in the tobacco chloroplast genome to reveal altered chloroplast ribosome pausing after high light exposure. Only one of the large inverted repeats is shown. Probes with very low signal intensities (<100) were not considered in this analysis. Dashed horizontal lines and bold gene names indicate two probes located in the psbA and psaC RFs with >2-fold changes in relative ribosome occupancy in high light for two or more subsequent time points (detailed magnifications are shown in B). The genome map was drawn with OGDRAW (Lohse et al., 2013). kbp, Kilobase pairs. Individual diagrams for each time point after the high light shift are shown in Supplemental Figure S7. B, Relative ribosome occupancy and the two potential light-dependent ribosome pausing sites in the psbA and psaC RFs. Relative ribosome occupancy within the psbA and psaC RFs is plotted as the fraction of probe signal to the summed RF signal for each of the indicated conditions and time points (see legend; control = 350 µmol m−2 s−1, shifted = 1,000 µmol m−2 s−1) that showed a maximum >2-fold change. A similar representative plot for petA is shown to illustrate unchanged ribosome occupancy in all other chloroplast RFs. Error bars depict standard deviations calculated from three independent biological replicates. Note that for better visual comparison between the shown subsequent time points of the time series, the only probes plotted are those for which data for all three relevant time points were determined in three biological replicates. Due to signal saturation for specific probes in particular replicates, certain data points in the 5′ region and around the genomic position of ∼900 bp within the psbA RF were excluded from this plot (see Supplemental Dataset S1 for data of individual replicates).

