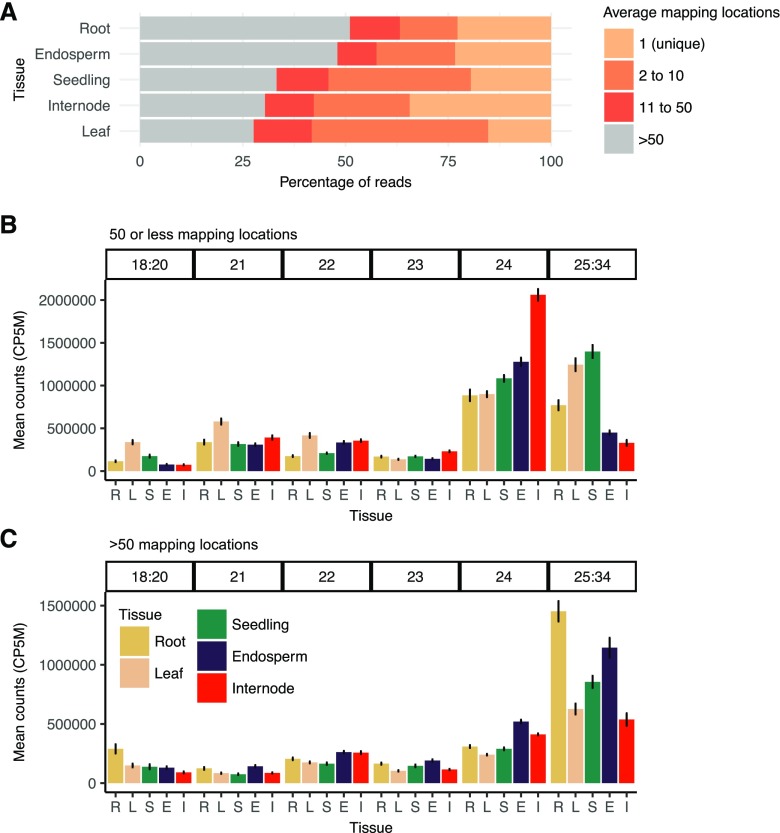
Figure 1.
Multimapping frequency and length distribution of sRNA reads. A, Average read multimapping frequency of sRNAs. Mapping frequency is shown for genome mapped reads (excluding structural RNAs) of length 18-nt to 34-nt that perfectly aligned with no mismatches to the B73 reference genome for all samples in this study, including inbreds and hybrids. For each sample, mapping rates were categorized into four mapping frequency bins and expressed as a proportion of all mapped reads, and then the distributions were averaged for each tissue. Reads with mapping frequency 1 have a single (unique) high-confidence mapping location. Reads were then categorized into bins with two to 10, 11 to 50, or greater than 50 mapping locations. B, Comparison of the relative abundance of different size classes (bar along top) of sRNAs between different tissues for sequences with fewer than 50 mapping locations. C, Relative abundance of sRNAs mapping to highly repetitive regions (more than 50 mapping locations). CP5M, Clusters with at least 10 counts per five million. Error bars denote se among genotypes. R = seedling root (n = 20), L = leaf (n = 18), S = seedling shoot (n = 21), E = endosperm (n = 28), and I = internode (n = 21).

