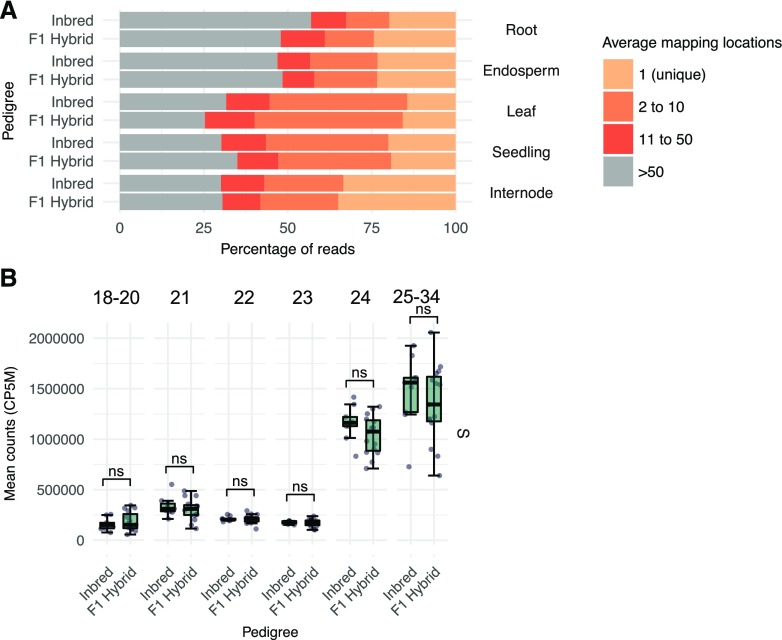
Figure 3.
Comparisons of sRNA profiles in inbreds relative to hybrids. A, Comparisons of multimapping rates in inbreds relative to hybrids. The average read multimapping frequency for all genome-matched sRNAs was summarized into four categories and then divided into averages for inbreds and F1 hybrids. Bars represent the average of all genotypes for each sample. B, Comparison of sRNA abundance between inbreds and hybrids for seedling shoot tissue. Each dot represents a genotype, and whiskers correspond to the first and third quartiles (the 25th and 75th percentiles). S = seedling shoot (n = 21). ns, Nonsignificant false discovery rate-adjusted P < 0.05, Student’s t test.

