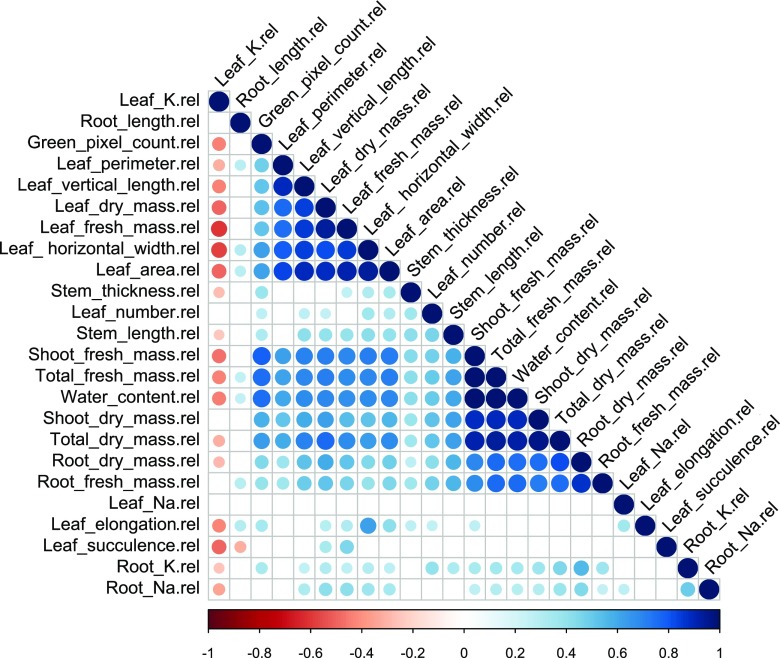
Figure 2.
Pearson correlation matrix of the recorded traits under salinity relative to control conditions (n = 6). Large circles represent strong correlations and smaller circles represent weaker correlations. The color scale indicates the sort of correlation, where 1 denotes completely positive correlation (dark blue) and −1 denotes completely negative correlation (dark red) between two traits. Only significant correlations are shown (P < 0.05).

