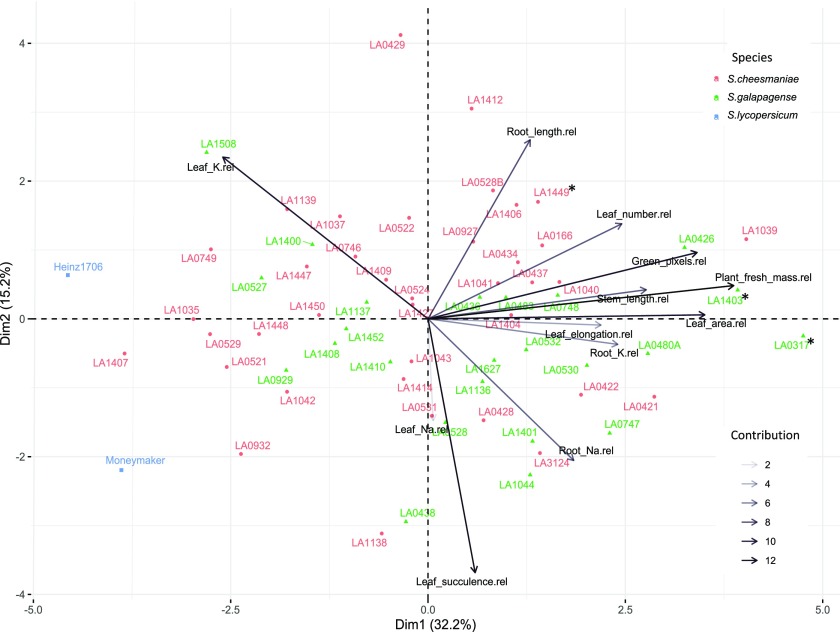
Figure 3.
PCA biplot of 62 Galapagos tomato accessions and two commercial tomato varieties (n = 6), based on the variance in 11 salt stress-related physiological traits, explained by two PC axes (Dim1 and Dim2). The two components explained 32.2% and 15.2% of the variance, respectively. Arrows denote the strength of the trait influence on the first two PCs. The transparency of the arrows indicates the contribution to the variance in the dataset, ranging from 2% (lightest) to 12% (darkest). The direction and length of the arrows indicate how each trait contributes to the first two components in the PCA. Aligned vectors indicate a strong positive correlation between the two traits. Vectors at right angles and opposites indicate no correlation and negative correlation, respectively. The first component shows that leaf K concentration is negatively correlated with the other representative traits. The second component shows that leaf elongation, leaf succulence, leaf and root Na concentrations, and root K concentration are negatively correlated with the other representative traits. Individual accessions are placed on the ordination plane. Different colors and symbols represent the different species, S. cheesmaniae (coral circles), S. galapagense (green triangles), S. lycopersicum (blue squares). Top performing accessions are marked with an asterisk (*).

