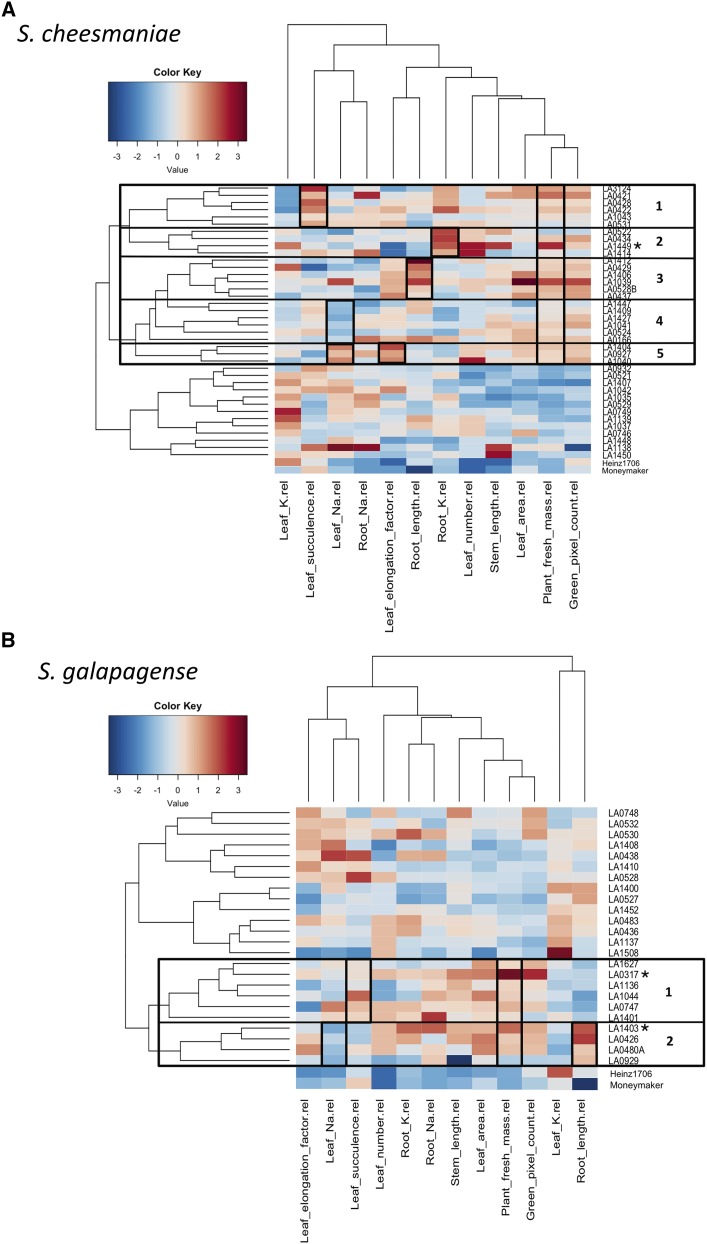
Figure 5.
Hierarchical clustering and heat map of Galapagos tomato accessions and important salinity tolerance-related traits, divided by species. Each column represents a trait and each row represents an accession (n = 6). Accessions with large fresh mass in salt stress relative to control conditions clustered together. However, they differed in other traits. Further clustering by similarity in traits is indicated in the figure, showing diversity in salt stress responses among Galapagos tomato accessions. A, S. cheesmaniae accessions divide into two main clusters. The accessions in the upper cluster share high values of total fresh mass. This cluster is further divided into five other clusters (indicated in the figure), each with a distinctive trait that differentiates it from other clusters (Table 2). B, S. galapagense accessions divide into two main clusters. The accessions in the lower cluster share high values of total fresh mass. This cluster is further divided into two other clusters (indicated in the figure), each with a distinctive trait that differentiates it from other clusters (Table 2). S. lycopersicum cultivars were added for reference. Top performing accessions are marked with an asterisk (*).

