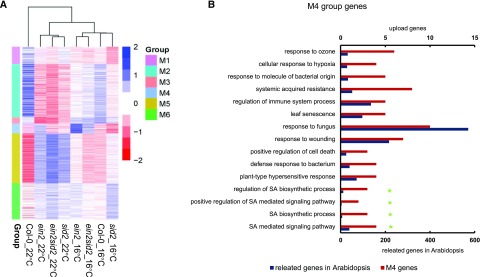
Figure 4.
Transcriptome analysis reveals differential contributions of SID2 to resistance at low and normal temperatures. A, Heat map of gene expression in six modules defined by WGCNA. Blue color indicates relatively high expression, and red color indicates relatively low expression. B, Gene Ontology term analysis of genes in module 4. Shown are the results with Bonferroni-corrected significance (P < 0.05). The green star makers indicate genes involved in SA biosynthesis and signaling.

