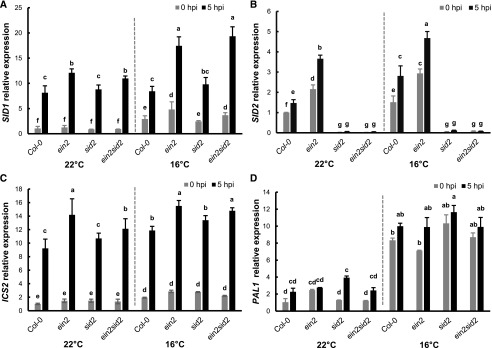
Figure 6.
Pst DC3000 induces SID1 and ICS2 expression in the ein2 sid2 mutant at low temperature. Relative expression levels of SID1 (A), SID2 (B), ICS2 (C), and PAL1 (D) were analyzed by RT-qPCR in leaves dipping inoculated by Pst DC3000 at 0 and 5 hpi. Expression levels are normalized by gene expression at 22°C in Col-0 at 0 hpi. Values represent means ± sd from two independent experiments. Letters indicate statistically significant differences among different genotypes determined by ANOVA (P < 0.05).

