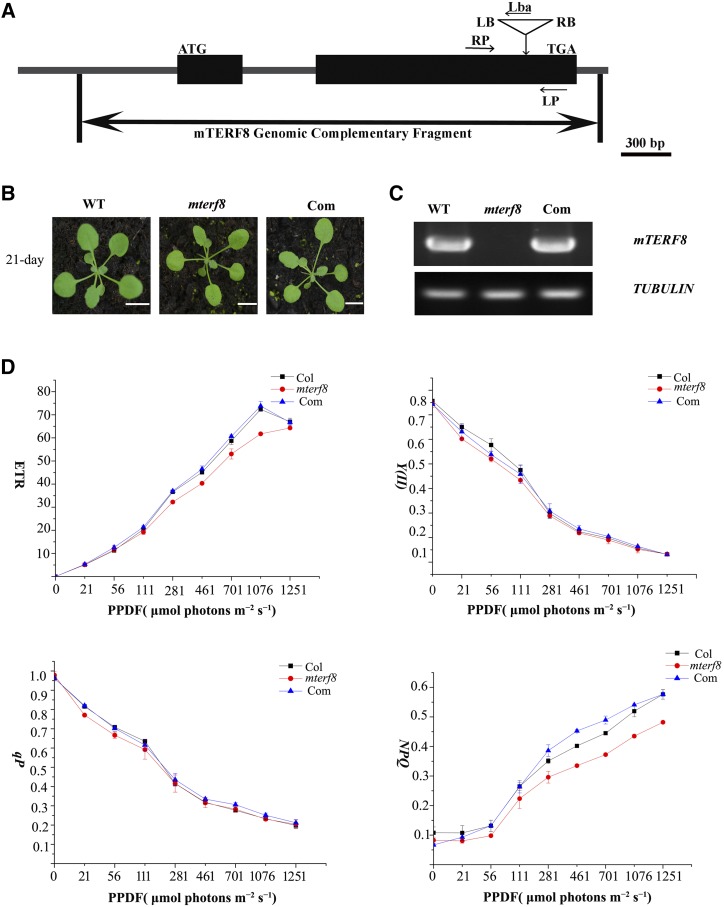
Figure 2.
Characterization of the knockout line of mTERF8. A, Schematic illustrating the genomic structure of mTERF8 and the location of the T-DNA insertion. Black boxes and lines indicate exons and introns, respectively. The T-DNA insertion site is indicated by a triangle. Both left border (LB) and right border (RB) are shown. Lba represents the left border primer of the T-DNA insertion. LP and RP represent the left and right genomic primers, respectively. B, Phenotypes of 21-d-old plants of wild type (WT), mterf8, and the complemented line (Com). Bars = 1 cm. C, RT-PCR analysis of mTERF8 expression in wild type, mterf8, and the complemented line (Com). TUBLIN was used as a control. D, Light-response curves of PSII quantum yield, photochemical quenching (qP), electron transport rate (ETR), and nonphotochemical quenching (NPQ) in the wild type (Col), mterf8 mutant, and the complemented line (Com). Measurements were performed at the following light intensities: 0, 21, 56, 111, 281, 461, 701, 1076, and 1251 μmol photons m−2 s−1. PPDF, photosynthetic photon flux density. Data were presented as mean ± sd. Each data point represents at least 9 independent plants.

