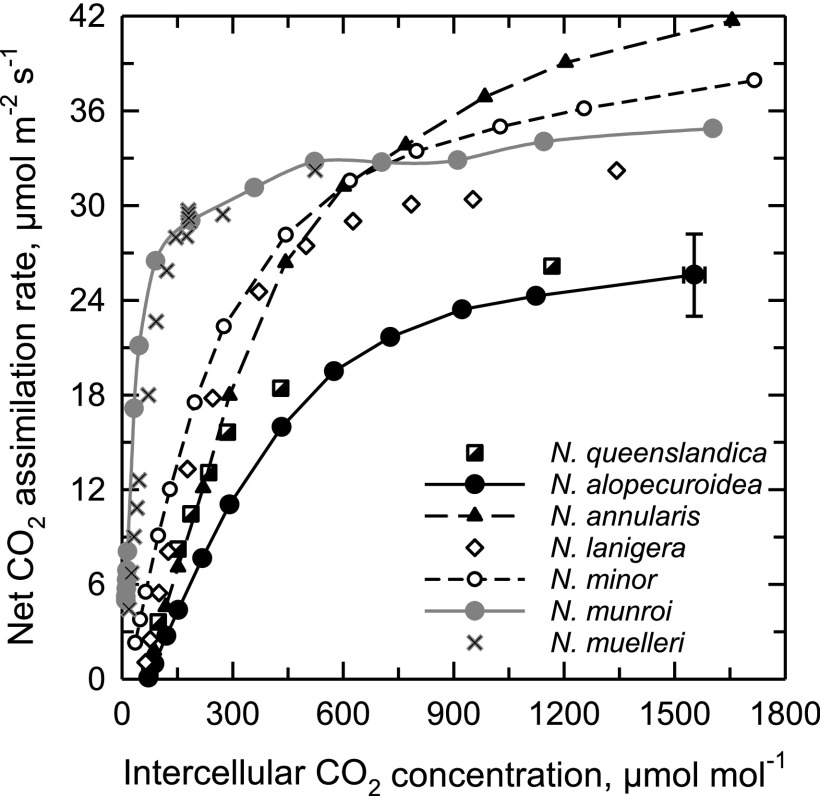
Figure 1.
The response of net CO2 assimilation rate to variation in intercellular CO2 concentration in seven species of Neurachne at 32°C. Each curve is a single representation of three to five measurements per species. The highest CO2 assimilation rate for N. alopecuroidea also presents ± se to show a typical se range.

