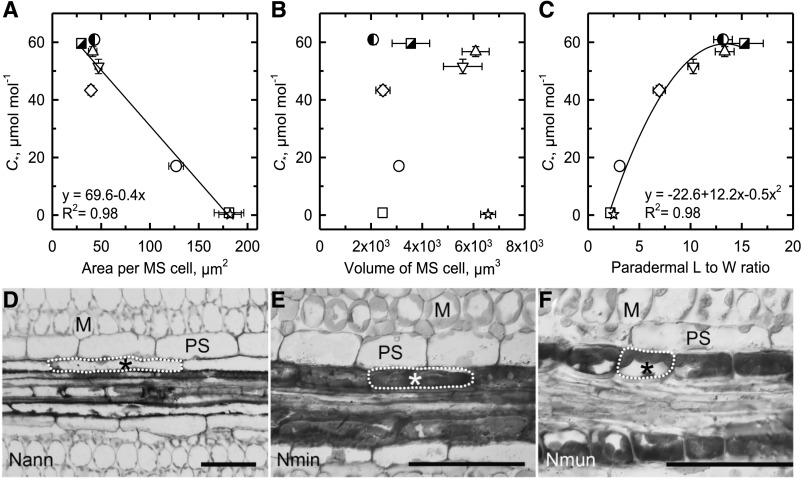
Figure 3.
The relationship between C* and dimensions of MS cells. A, MS cell area in planar cross section. B, MS cell volume. C, MS cell L:W in a paradermal section in eight species of Neurachnineae. Values were determined from planar cross sections of TEM images (A and B). Values were determined from light microscopic images of planar paradermal sections (C). Mean ± se; n = 3 plants per species; 10 images per plant. Significant regressions at P ≤ 0.05 are shown. N. alopecuroidea (◑), N. annularis (▽), N. lanigera (◇), N. minor (○), N. munroi (⬜), N. muelleri (☆), N. queenslandica (△), and T. mitchelliana (◪). See Supplemental Table S1 for values and statistical tests. D to F, Paradermal view of vascular sheath cells. Nann, N. annularis; Nmin, N. minor; Nmun, N. munroi. Single MS cells are outlined (dashed line). Scale bars = 50 μm; *, MS, M, and PS.

