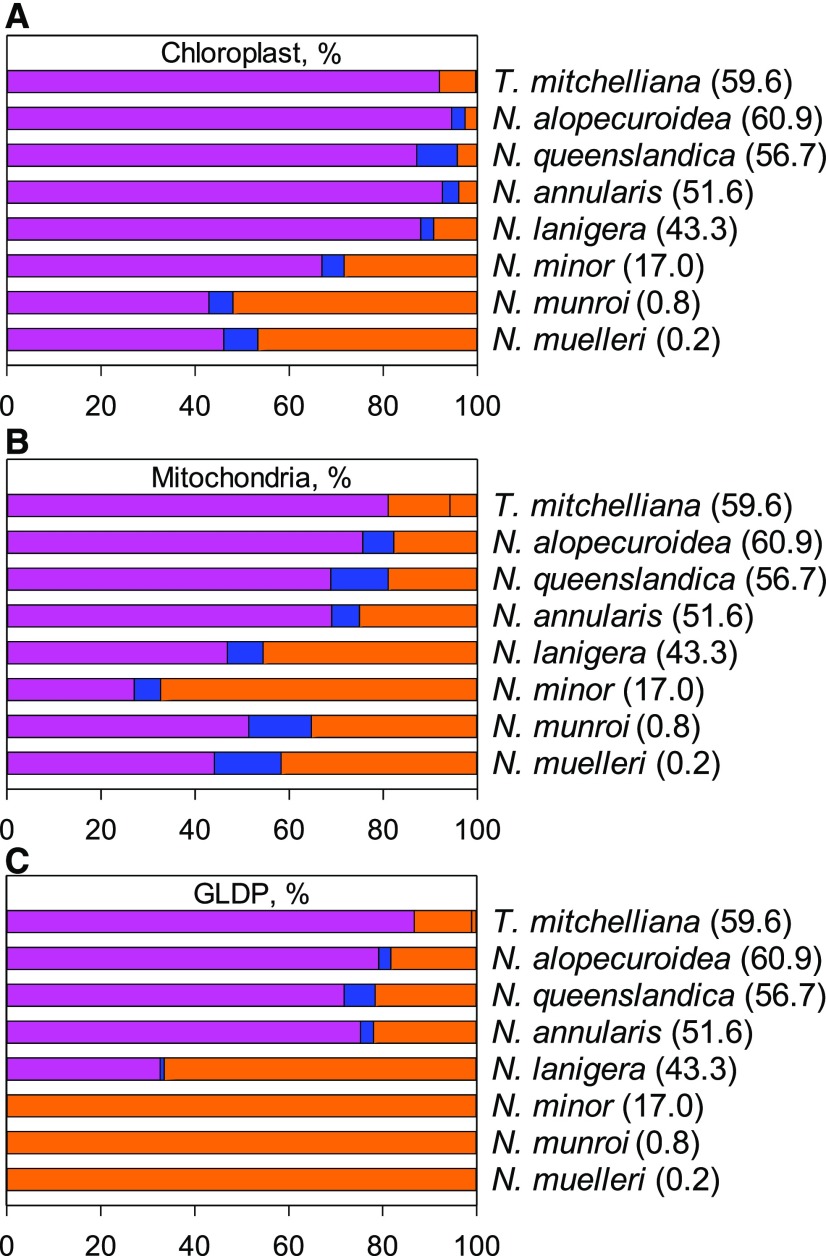
Figure 6.
The allocation of organelles and GLDP among leaf tissue types. A, Chloroplast. B, Mitochondria. C, GLDP among M (magenta, left bar), PS (blue, middle bar), and MS (orange, right bar) tissues in eight species of Neurachnineae. Values in parentheses represent mean C* values for each species. n = 3 plants per species; 10 images per plant. See Supplemental Table S2 for mean values, statistical tests, and quantification procedure.

