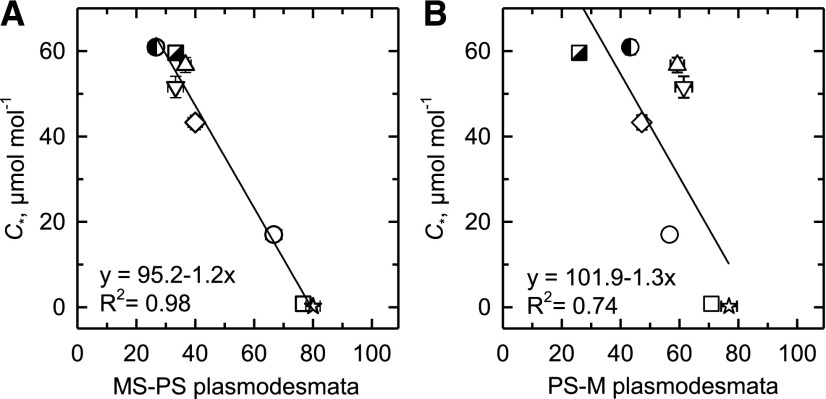
Figure 7.
The relationship between C* and PD frequencies in walls between leaf tissue types. A, The frequency of PD between MS and PS cells. B, The frequency of PD between PS and M cells. Mean ± se; n = 3 plants per species; 10 images per plant. Significant linear regressions at P ≤ 0.05 are shown. N. alopecuroidea (◑), N. annularis (▽), N. lanigera (◇), N. minor (○), N. munroi (⬜), N. muelleri (☆), N. queenslandica (△), and T. mitchelliana (◪). See Supplemental Table S3 for mean values and statistical tests.

