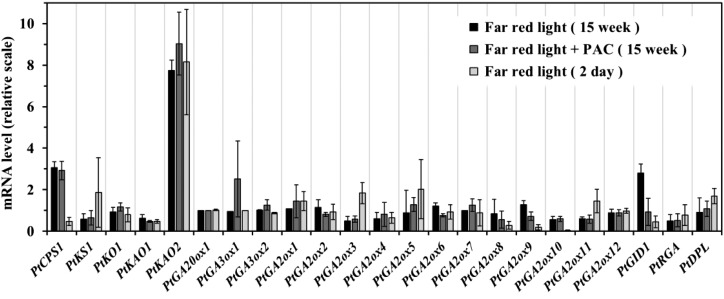
Figure 4.
The expression response of genes involved in GA metabolism and signaling pathways to low R:FR in P. tabuliformis seedlings. The expression levels of each gene are relative to the value of the water control group (set at 1). Seedlings were grown under a 14:10 h photoperiod. FR, low R:FR light conditions. The mean of three biological replicates is plotted with SE.

