Figure 5.
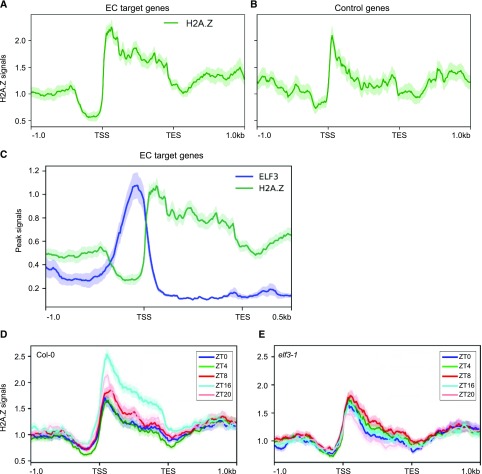
ELF3 and H2A.Z occupancy of EC target genes. A and B, H2A.Z enrichment (normalized HTA11-FLAG ChIP-seq reads) on 52 EC target genes (A) and control genes (B) was analyzed. For the class of “control genes,” a sample of 52 genes was randomly selected to compare their H2A.Z occupancy with EC target genes (see also Supplemental Table S2). (A) and (B) are plotted from 1 kb upstream of the TSS to 1 kb downstream of the TES of the corresponding genes. C, ELF3 and H2A.Z average binding plot on 52 EC target genes. D and E, H2A.Z enrichment in wild type (D) and elf3-1 mutant (E) at various time points under long day conditions.

