Figure 6.
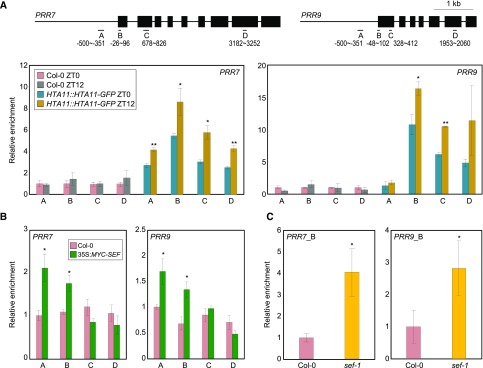
H2A.Z deposition at PRR7 and PRR9 loci by the SWR1 complex. In (A) to (C), fragmented DNA was eluted from the protein–DNA complexes and used for qPCR analysis. Enrichment was normalized relative to eIF4A. Three independent biological replicates were averaged, and the statistical significance of the measurements was determined. Bars indicate the means ± se. A, Accumulation of H2A.Z at clock gene loci. Two-week–old plants grown under neutral day conditions were used for ChIP analysis with anti-GFP antibody. Gene structures are presented (upper representation). Underbars represent the amplified genomic regions. Statistically significant differences between ZT0 and ZT12 samples are indicated by asterisks (Student’s t test, *P < 0.05, **P < 0.01). B, Binding of SEF to clock gene promoters. Two-week–old 35S:MYC-SEF transgenic plants grown under neutral day conditions were harvested at ZT12. Statistically significant differences between wild-type and 35S:MYC-SEF plants are indicated by asterisks (Student’s t test, *P < 0.05). C, Recruitment of Pol II at PRRs in sef-1. Two-week–old plants grown under neutral day conditions were harvested at ZT12 and used for ChIP analysis with an anti-N terminus of Arabidopsis Pol II antibody. qPCR was performed with a primer pair amplifying the B region of each gene promoter (see also Fig. 6A). Statistically significant differences between wild-type and sef-1 plants are indicated by asterisks (Student’s t test, *P < 0.05).

