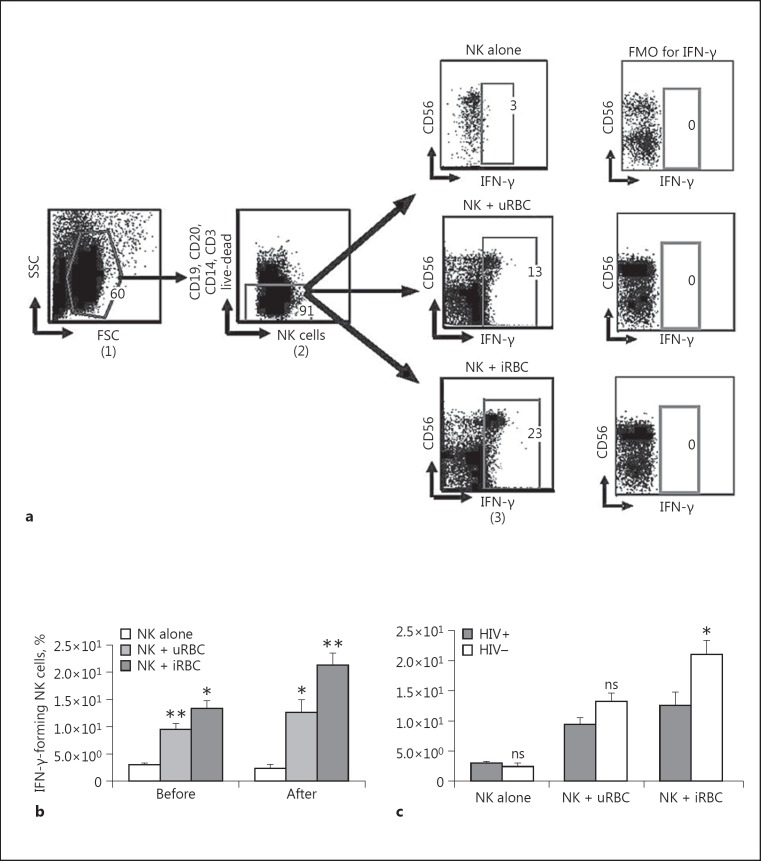
Fig. 2.
NK cell IFN-γ production following coculture with either Plasmodium falciparum-infected RBC or uRBC red blood cells. Purified NK cells were cocultured either with enriched red blood cells or uRBC (1:3) for 24 h and stained for flow cytometric analysis. NK cell IFN-γ production before and after coculture was measured using multiparametric flow cytometric analysis. a Gating schema for purified NK cell IFN-γ production coculture with iRBC. The strategy shows NK cell IFN-γ production before and after coculture with either iRBC or uRBC. Lymphocytes were defined from side scatter (SSC) versus forward scatter (FSC) gate (1). NK cells are identified as live lymphocytes that are CD3, CD14, CD20, and CD19 negative but expressing CD56 (2). CD56 versus IFN-γ gate (3) was used to define CD56+/IFN-γ+ cells (NK cells producing IFN-γ). The resulting data were analyzed and depicted for the overall populations, showing a comparison before and after coculture (b) and a comparison of NK cell IFN-γ production between the HIV+ and HIV- groups (c). The mean ± SD of 5 different repeat experiments are shown. A Mann-Whitney test was used to compare medians (p < 0.05). FMO, Fluorochrome Minus One. * p < 0.05. ** p < 0.01. ns, not significant (p > 0.05).

