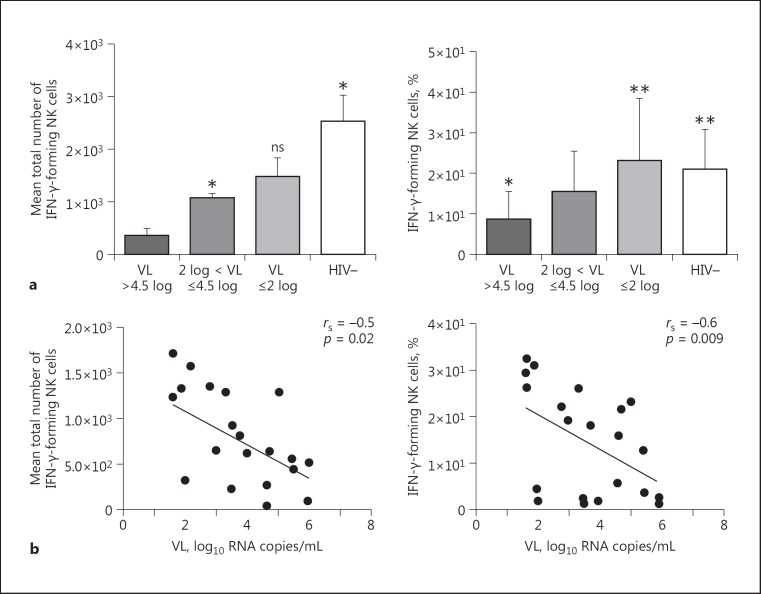
Fig. 3.
Impact of HIV plasmatic VL on NK cell IFN-γ production after coculture with iRBC. a Antiretroviral naïve HIV-1-infected people were classified into 3 groups according to VL level: VL <2 log, 2 log < VL ≤4.5 log, and VL >4.5 log. Quantification of IFN-γ produced by NK cells using multiparametric flow cytometric analysis in each group is shown; a Mann-Whitney test was used to compare the means between groups (p < 0.05). * p < 0.05. ns, not significant (p > 0.05). b Inverse correlation between NK cell IFN-γ production and plasmatic VL.

