FIG 1.
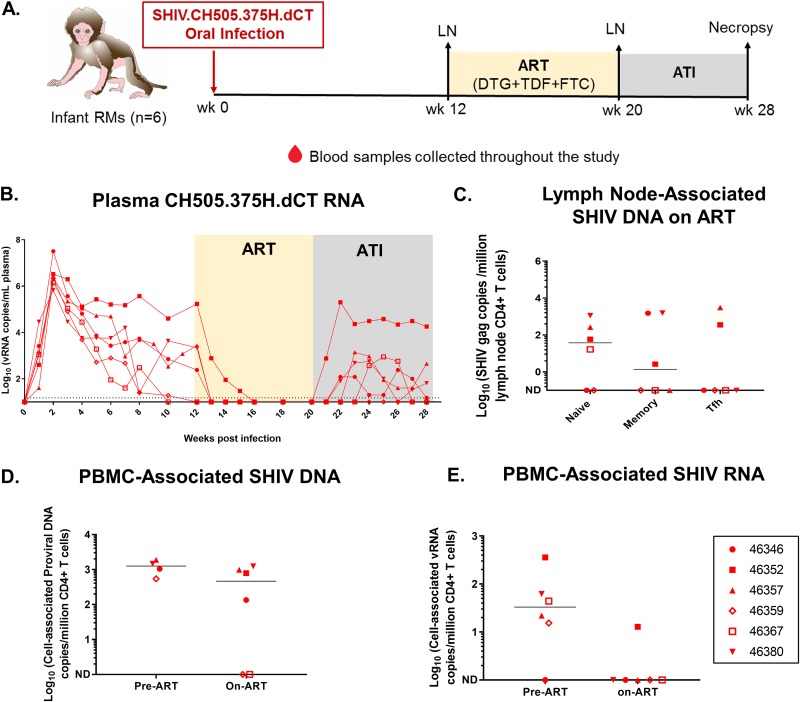
SHIV.CH505.375H.dCT replication kinetics prior to and following ATI in infant RMs. (A) Schematic representation of SHIV.CH505.375H.dCT infection (0 to 12 weeks), ART (12 to 20 weeks), and ATI (20 to 28 weeks) in infant RMs. Blood samples were collected at weekly intervals throughout the study, and peripheral lymph nodes (LNs) were collected at 12 wpi and while the RMs were on ART (20 wpi), (B) The kinetics of plasma SHIV RNA over 28 weeks were measured by qRT-PCR. (C) Peripheral lymph nodes from RMs on ART (20 wpi) were collected, and the level of naive, memory, and Tfh CD4+ T cell-associated SHIV DNA was estimated by qPCR. (D and E) The amounts of cell-associated SHIV DNA (CA-SHIV DNA) (D) and cell-associated SHIV RNA (CA-SHIV RNA) (E) per million CD4+ T cells in peripheral blood were monitored by ddPCR in the infant RMs before ART (6 wpi) and on ART (18 wpi). The sensitivity of the ddPCR assay was detection of 1 SHIV gag copy in 10,000 CD4+ T cells. Therefore, only those animals that had ≥10,000 CD4+ T cells at a particular time point were included in the analysis. Each symbol represents an individual animal. Yellow and gray boxes represent the duration of ART (weeks 12 to 20) and the duration of ATI (weeks 20 to 28), respectively. Medians are indicated as horizontal lines on the dot plots. Infants with a plasma VL of <15 copies/ml at 12 wpi are represented by open symbols.

