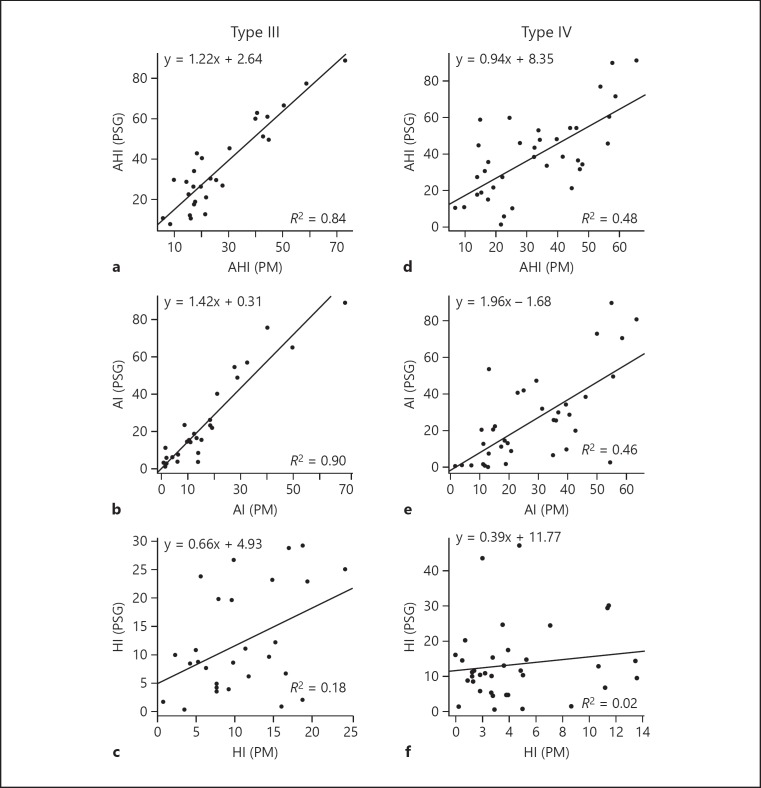
Fig. 1.
Linear regression plot with AHI, AI, and HI values for the type III and type IV PM devices, along with AHI, AI, and HI values from PSG testing. The solid line indicates the linear regression. The regression equation and R2 (coefficient of determination) are also displayed. AHI, apnea-hypopnea index; AI, apnea index; HI, hypopnea index; PSG, polysomnography; PM, portable monitor.

