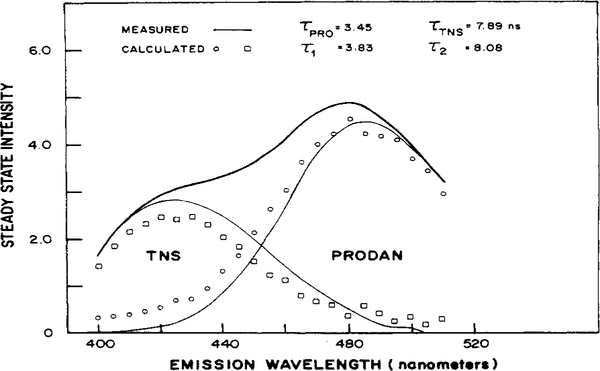
Figure 2.
Resolution of TNS and PRODAN mixture. The separately measured emission spectrum of the mixture is shown as a bold line (—), and the spectra of TNS and PRODAN as thinner lines (—). The calculated spectra are shown for the 8.08 ns (□) and 3.83 ns (○) components. The solutions were In 100% ethanol.

