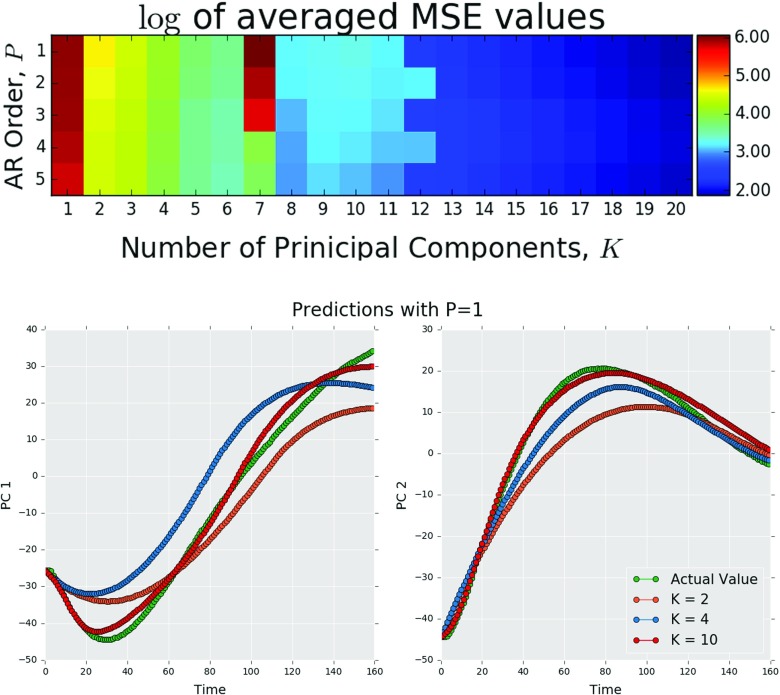
Fig. 7.
Log of the mean MSE values created using leave one sample out cross-validation as a function of the autoregressive order P and total number of principal components K (above). Mean MSE values for PCs 1 and 2 decrease as the number of the total number of principal components K increases (below) (Color figure online)

