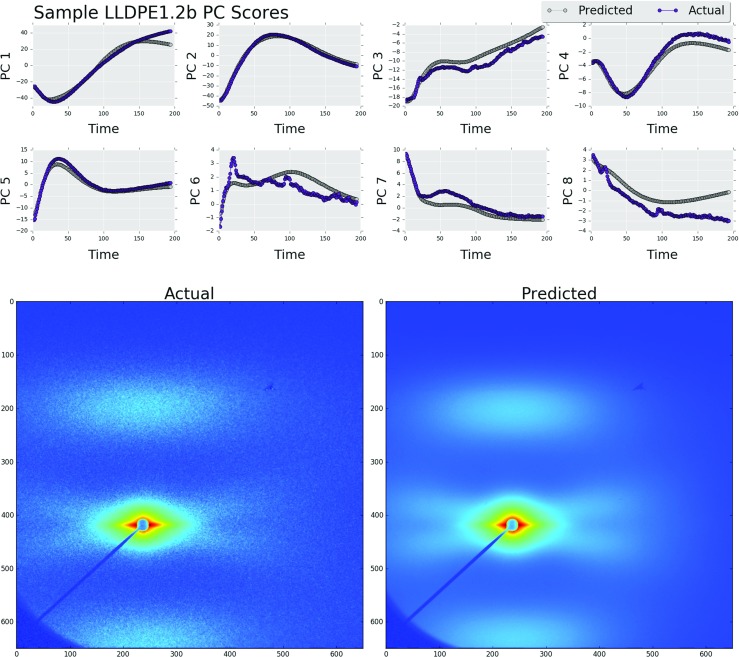
Fig. 8.

Predicted and actual principal component scores for sample LLDPE1.2b (above). The original image (bottom left) and the predicted image (bottom right). The mean squared error value over the predicted principal component scores had a value 2.11 (Color figure online)
