Fig. 1.
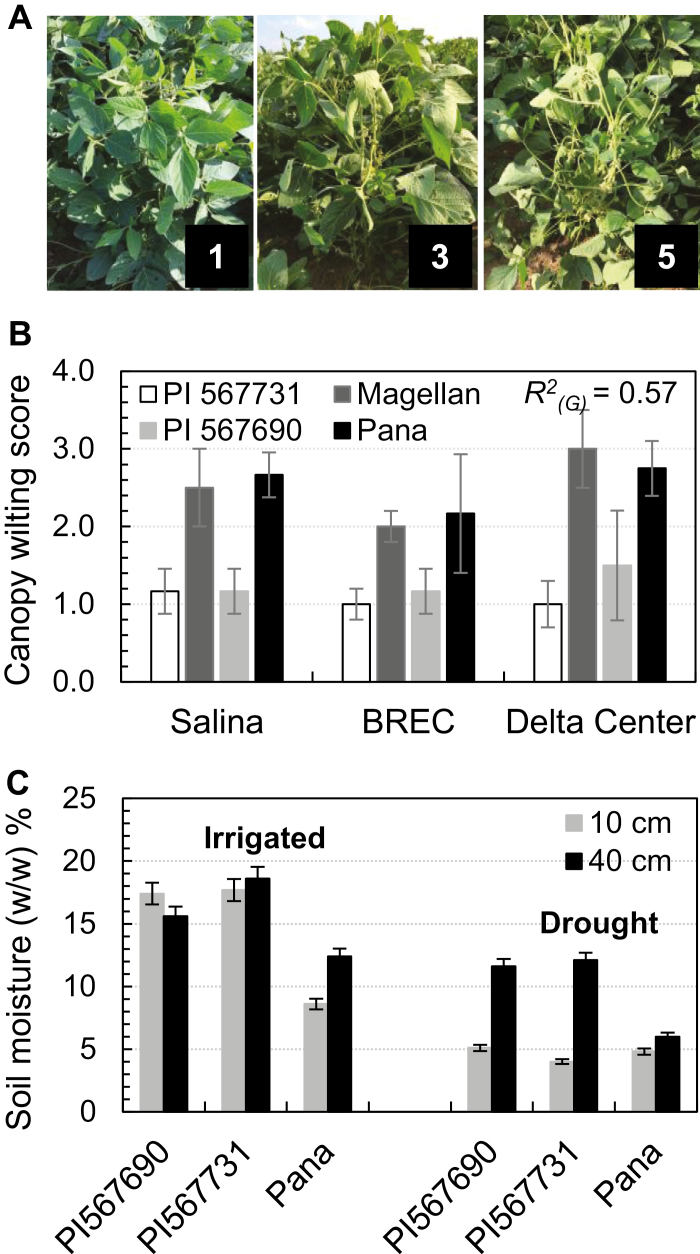
Canopy wilting and water use of the parental lines in the field. (A) Field phenotyping for canopy wilting using the canopy wilting score (WS). WSs were used to represent canopy wilting levels from 1 to 5. (B) Canopy wilting of the parental lines under drought conditions. Data were recorded for the lines at three locations for 2–3 years. Significant genotypic differences were observed with P<0.0001, explaining 57% of phenotypic variations based on ANOVA across the three locations. (C) Soil moisture underneath the parental lines. Soil moisture was measured at 10 cm and 40 cm underneath the soil surface of the parental lines planted in the sandy soil at Delta Center, MO in 2014. Measurements were taken 3 weeks after the last rain. Columns and bars represent the mean and SDs of 10 replicates.

