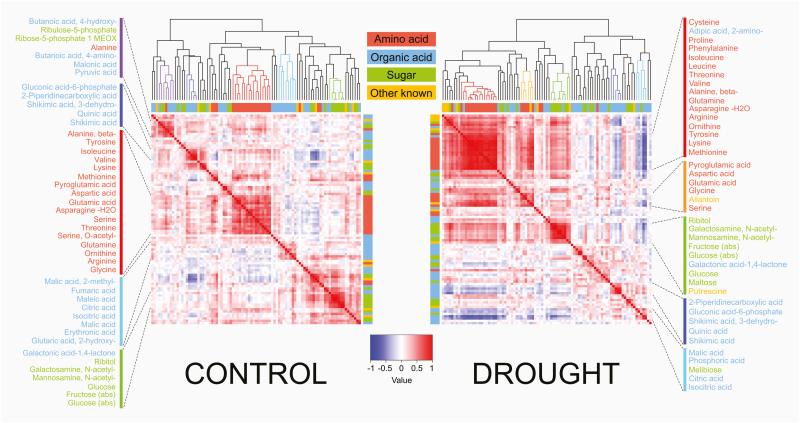
Fig. 1.
Hierarchical clustering and heatmap of the metabolites versus metabolites pairwise correlations under the two treatments for the 292 rice accessions. Spearman correlations under control (left) and drought stress (right) conditions. Colour bars on the top and side of the heatmaps represent the four main classes of metabolites (amino acid, organic acid, sugar, and other known). In the dendrograms, main clusters are coloured according to the class of the majority of the metabolites they included: red (amino acids), light blue (TCA cycle organic acids), blue (shikimic acid pathway), green (sugars), purple (mixed cluster), and yellow (mainly amino acid). All the other minor clusters are coloured in black. The metabolites included in each cluster are displayed at the side of the two heatmaps. Metabolite names are coloured according to the four main classes of known metabolites mentioned above.

