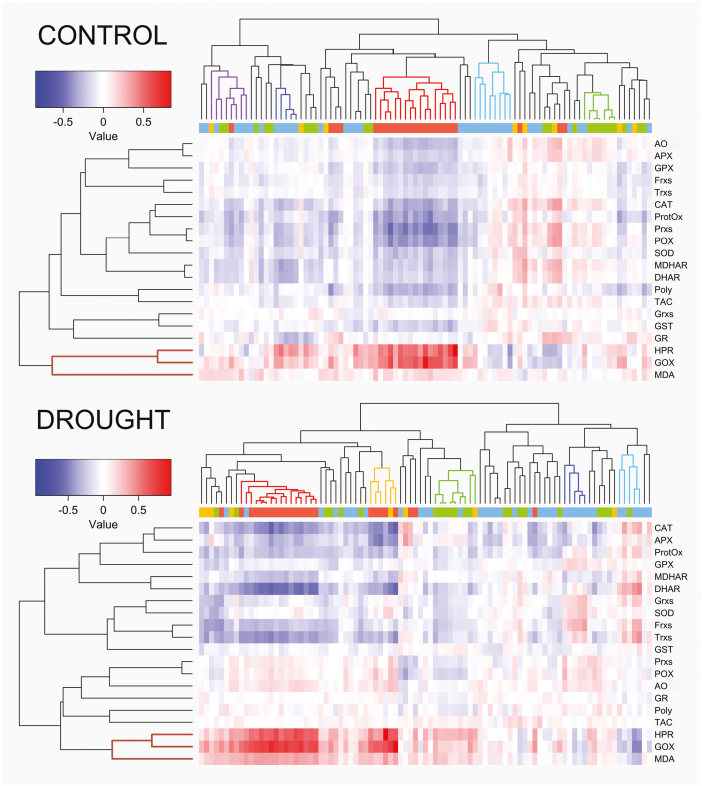
Fig. 2.
Hierarchical clustering and heatmap of the oxidative stress markers/enzymes versus metabolites pairwise correlations under the two treatments for the 292 rice accessions. Spearman correlations under control (top) and drought stress (bottom) conditions. The metabolite colour code of the bar below the dendrograms as well as the colour of the main clusters are the same as in Fig. 1. Malondialdehyde (MDA), polyphenols (Poly), protein oxidation (ProtOx), total antioxidant capacity (TAC), ascorbate oxidase (AO), ascorbate peroxidase (APX), catalase (CAT), dehydroascorbate reductase (DHAR), ferredoxins (Frxs), glycolate oxidase (GOX), glutathione peroxidase (GPX), glutathione reductase (GR), glutaredoxins (Grxs), glutathione S-transferase (GST), hydroxypyruvate reductase (HPR), monodehydroascorbate reductase (MDHAR), peroxidase (POX), peroxiredoxins (Prxs), superoxide dismutase (SOD), and thioredoxins (Trxs).

