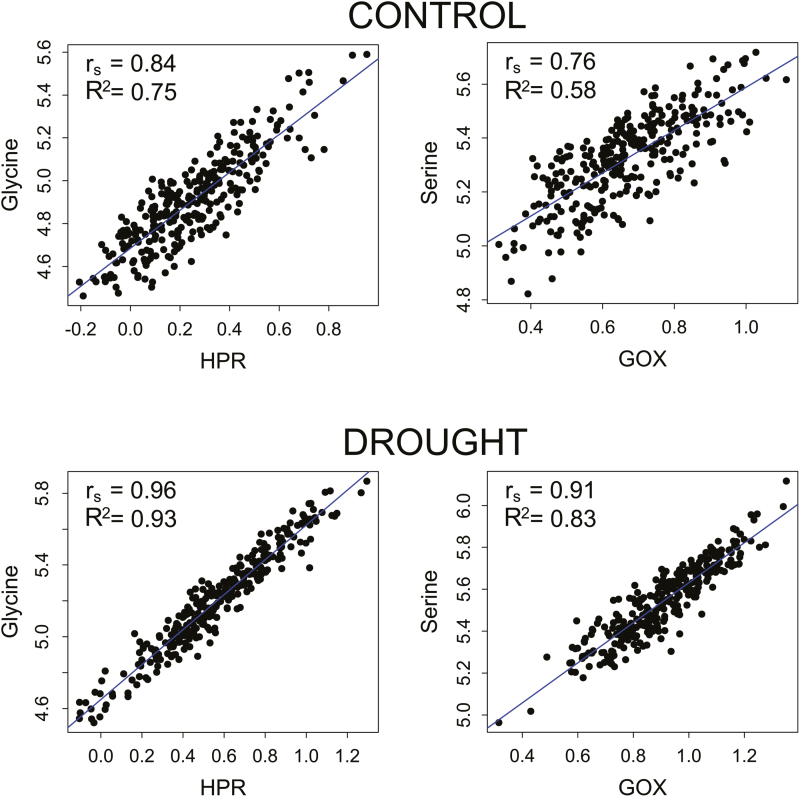
Fig. 3.
Linear models between the photorespiratory enzymes and hydroxypyruvate reductase, and glycolate oxidase and the amino acids glycine and serine under the two treatments. Linear models of the two best correlations between MetabOxi variables under the two treatments. Axes are expressed as log10-transformed detector response values for the metabolites glycine and serine and log10 enzyme activity for hydroxypyruvate reductase (HPR) and glycolate oxidase (GOX). In each plot are reported the Spearman correlation value (rs) between the two variables and the variation explained by the specific linear model (R2). (This figure is available in colour at JXB online.)

