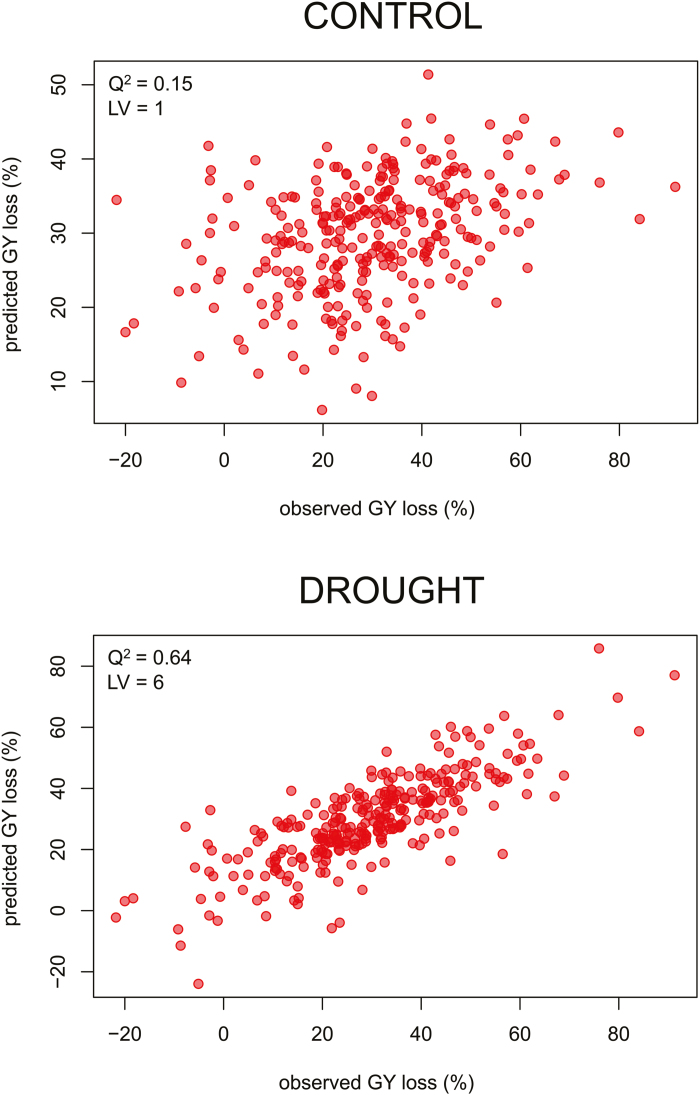
Fig. 4.
Predicted versus observed values of the control and drought PLSR models for the prediction of grain yield loss in the 292 rice accessions. PLSR plot of the cross-validated models for GY loss based on the control (top) and drought (bottom) values of the 111 MetabOxi variables. Predictability (Q2) and linear latent variables (LVs) of the two models are reported. (This figure is available in colour at JXB online.)

