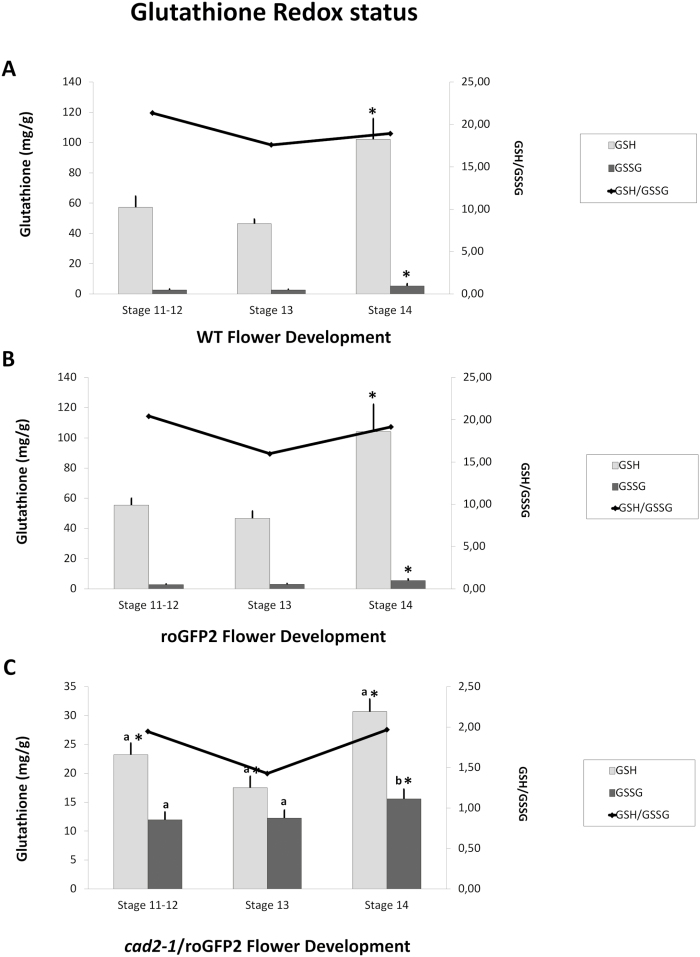
Fig. 8.
GSH and GSSG contents and GSH/GSSG ratios of flowers at different stages of development. (A) WT; (B) roGFP2; (C) cad2-1/roGFP2. Asterisks indicate statistical significance (P≤0.05) between different developmental stages. a and b indicate statistical significance at P≤0.01 and P≤0.05, respectively, between different lines.

