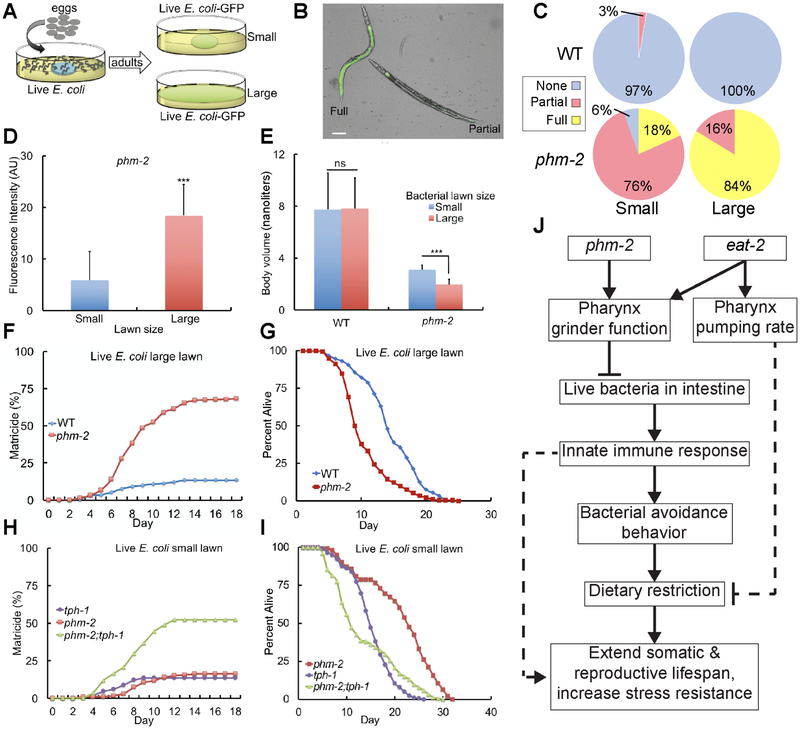
Figure 5. Bacterial avoidance behavior by phm-2(lf) animals limits bacterial accumulation in the intestine and increases survival.
(A) Schematic of method. (B) Representative bright field photographs and (C) Quantification of categories of phenotype severity. Animals were categorized as Full (E. coli OP50-GFP throughout the intestine), Partial (E. coli OP50-GFP in part of the intestine) or None (no detectable fluorescence in the intestine). Five biological replicates with N≥112 animals were analyzed. Scale bar = 50 μm. (D) Quantification of whole animal fluorescence. phm-2(am117) adult animals were cultured with a small (blue) or large (red) lawn of E. coli OP50-GFP for 24 hours. Values in arbitrary units (AU) are the average (+/−S.D), N≥13 animals. ***, P < 0.001, by Student’s t-test. (E) Worm volume as in Figure 1 (N=40-55 animals analyzed; ns, not significant, P > 0.05 by Student’s t-test). (F, H) Values are the cumulative fraction of animals that displayed matricidal hatching versus days of adulthood. Genotypes were wild type, phm-2(am117), and tph-1(mg280). Panel F is based on six to eight biological replicates, N=295-342 animals, and panel H is based on three biological replicates, N≥168 animals. (G) Percent alive for wild type and phm-2(am117) animals cultured on a large lawn of live E. coli, and (I) for phm-2(am117), tph-1(mg280), and phm-2;tph-1 animals cultured on a small lawn of live E. coli. Note that animals that died of matricidal hatching were not censored from these data. See Table S6 for summary statistics. (J) Model of the mechanism of phm-2(lf) and eat-2(lf) lifespan extensions. Dotted lines indicate uncertainty.
See also Table S6.

