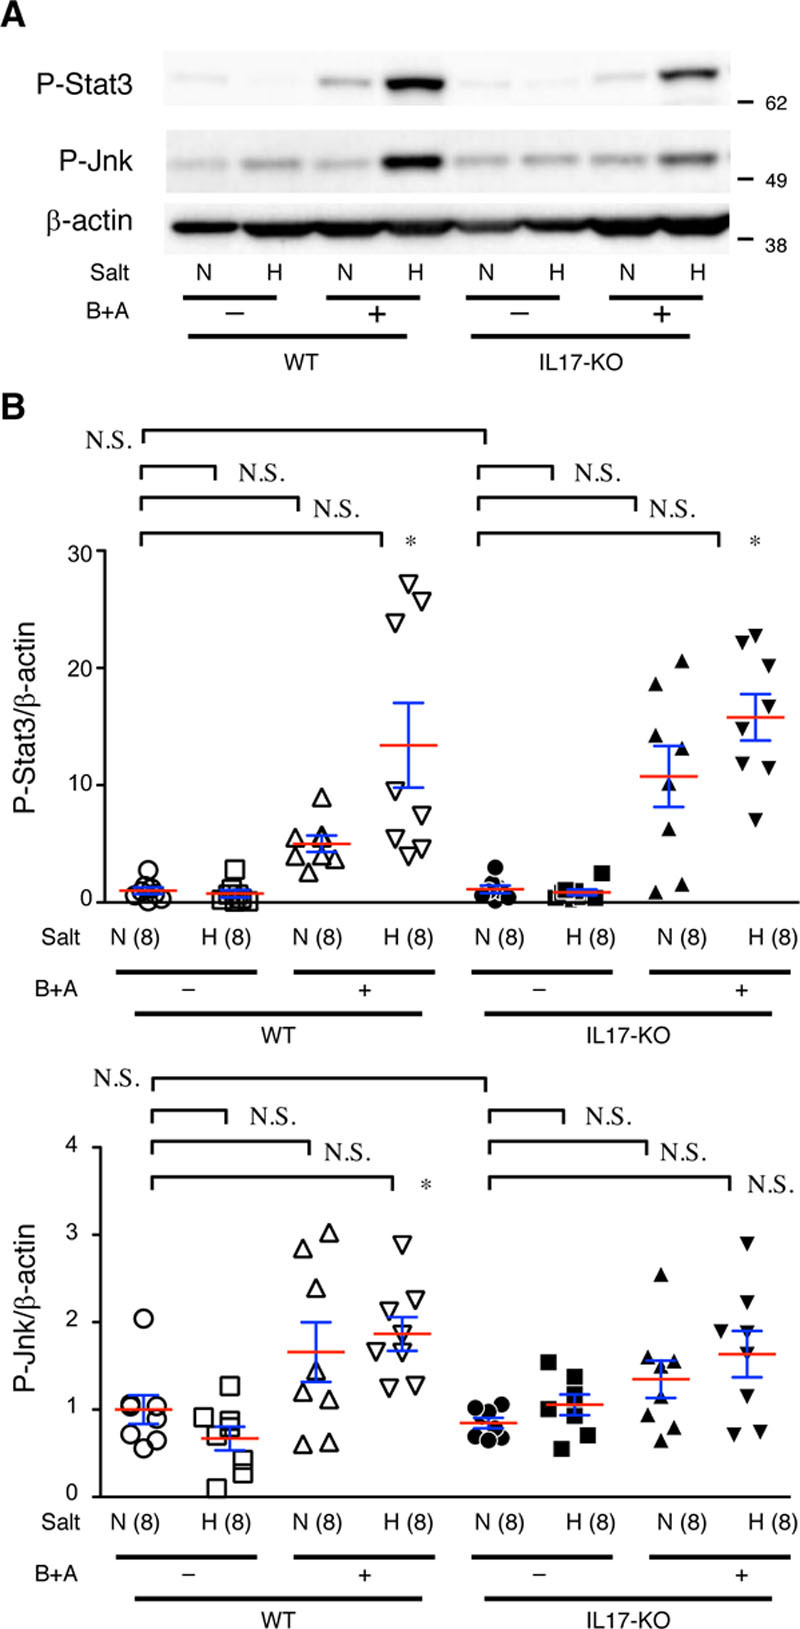
Figure 9.

Proinflammatory signaling in the aorta. A, Representative images from immunoblotting for P-Stat3 and P-Jnk. B, Quantitative analysis. β-actin served as an internal loading control. WT (wild type) and IL-17KO (IL [interleukin]-17A knockout) mice were treated with (H) and without (N) high salt and β-aminopropionitrile+angiotensin II (B+A). The means (red lines)±SEs (blue lines) are presented for 8 independent experiments in each group. *P<0.05, **P<0.01. N.S. indicates not significant.
