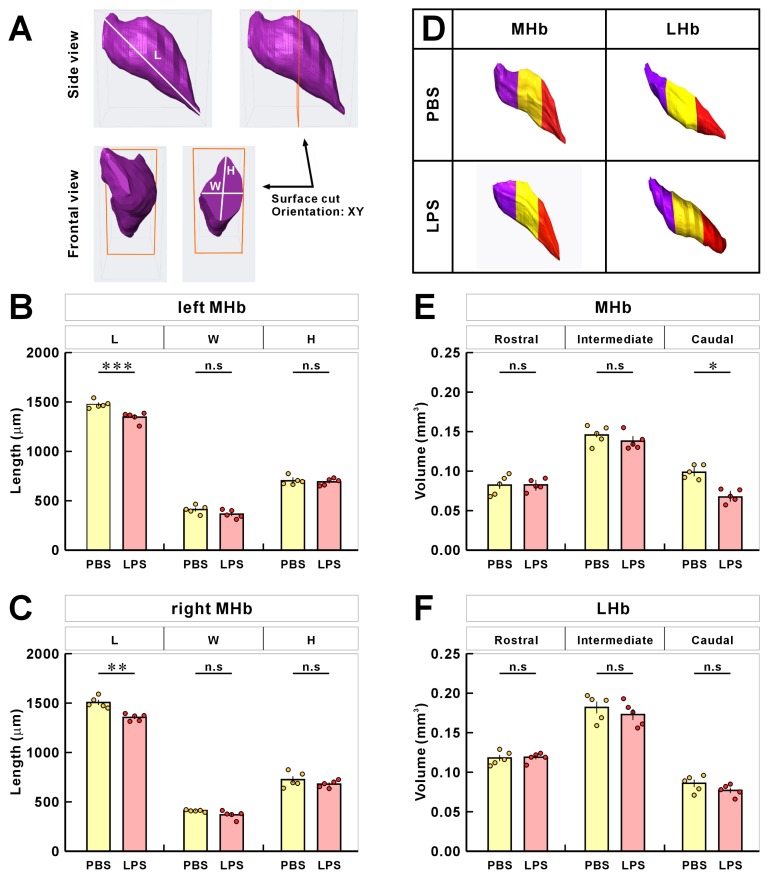
Fig. 5.
3D reconstruction and shape analysis of MHb. (A) Schematic definition of length (“L”) from rostral to caudal end, width (“W”), height (“H”) after surface cut at the center. The measured lengths in the left MHb (B) and right MHb (C) were reduced in the LPS model compared with control mice. (D) MHb and LHb subdivisions were rostral, intermediate, and caudal as shown in separate colors: purple, rostral; yellow, intermediate; red, caudal. (E and F) There are no volume differences seen for the rostral and middle parts between the control and LPS groups. The volumes of the caudal region in LPS-treated mice are smaller than those of the control mice. Dots represent values of individual mice and vertical lines indicate SEM (PBS, n=5, LPS, n=5 mice; *p<0.05).

