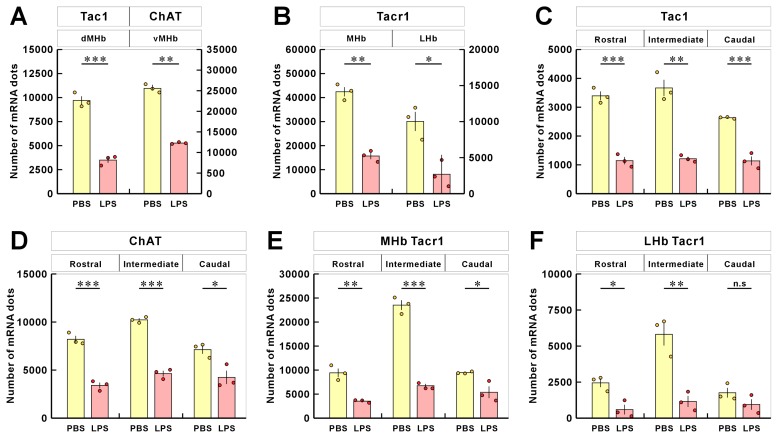
Fig. 7.
3-D RNAscope analysis of Tac1, ChAT, and Tacr1 mRNA expression from in situ hybridization assays. Quantification of each mRNA dot for (A) Tac1 and ChAT, (B) Tacr1. (C~F) Quantification of regional mRNA dot changes for each gene in rostral, intermediate, and caudal regions. Dots represent values of individual mice and vertical lines indicate SEM (PBS, n=3, LPS, n=3 mice; *p<0.05, **p<0.01, ***p<0.001).

