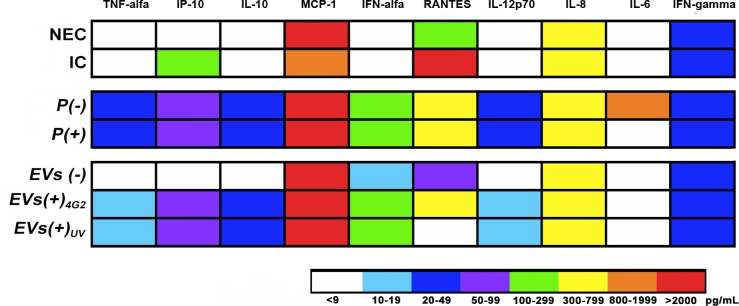
Fig 6. Quantification of soluble mediators produced by endothelial cells EA.hy926 exposed to pellets (P+ or P-) or EVs.
Heat map showing the variations in the concentration (pg/mL) of cytokines and chemokines produced by EA.hy926 exposed to the pellets or EVs of infected or uninfected macrophages. The average concentration of two independent cultures is shown in duplicate. The evaluated conditions were: Non-exposed cells (NEC); infected endothelial cells with DENV-2 MOI: 0.2 (IC); pellets from non-infected macrophages (P(-)); or from infected macrophages (P(+)), EVs purified from non-infected macrophages (EVs (-)); or from infected macrophages (EVs (+)) treated with 4G2 antibody (EVs (+)4G2) or UV irradiated (EVs (+)UV).

