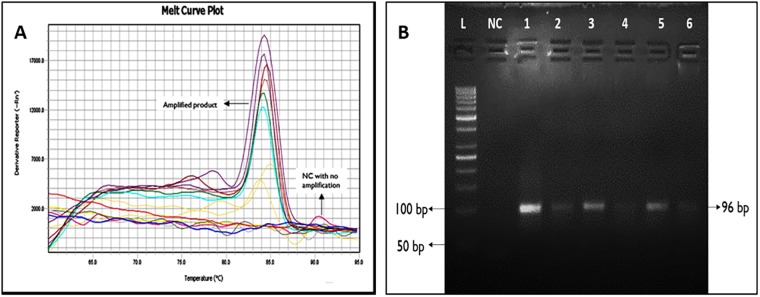
Fig 2.
A: Melting curve analysis of TTV and / or TLMV real-time PCR products: the figure shows the specific melting temperature of human TTV and/ or TLMV PCR products. Negative control and allenovirus negative samples showed no amplification with similar melt curve pattern. (B) TTV detection by electrophoresis after qPCR on agarose gel. Lane 1–6: patients with TTV infection; lane NC: Negative Control; lane L: 50 bp ladder.

