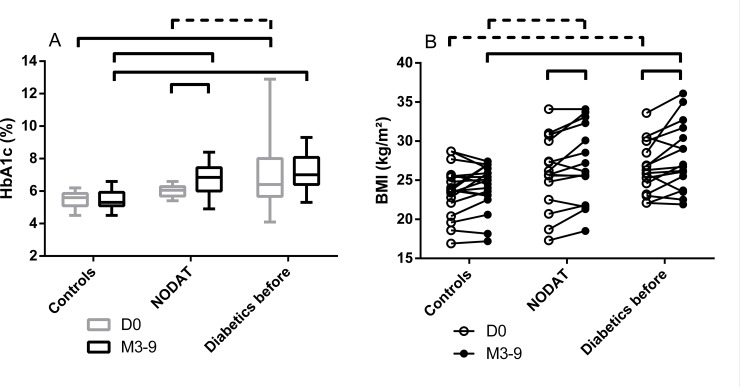
Fig 2.
Glycated hemoglobin (A) and Body Mass Index (B) of included patients, before and after transplantation according to their diabetic status. Bars indicate significant differences and dotted bars indicate trends (p<0.1) between groups (standard one-way ANOVA). Number of patients: (A) D0: Controls, n = 17; NODAT, n = 12; diabetics before transplantation, n = 16. M3-9: Controls, n = 18; NODAT, n = 14; diabetics before transplantation, n = 17. (B): no missing data both at D0 and M3-9: Controls, n = 19; NODAT, n = 15; diabetics before transplantation, n = 16. NODAT: New Onset Diabetes After Transplantation.

