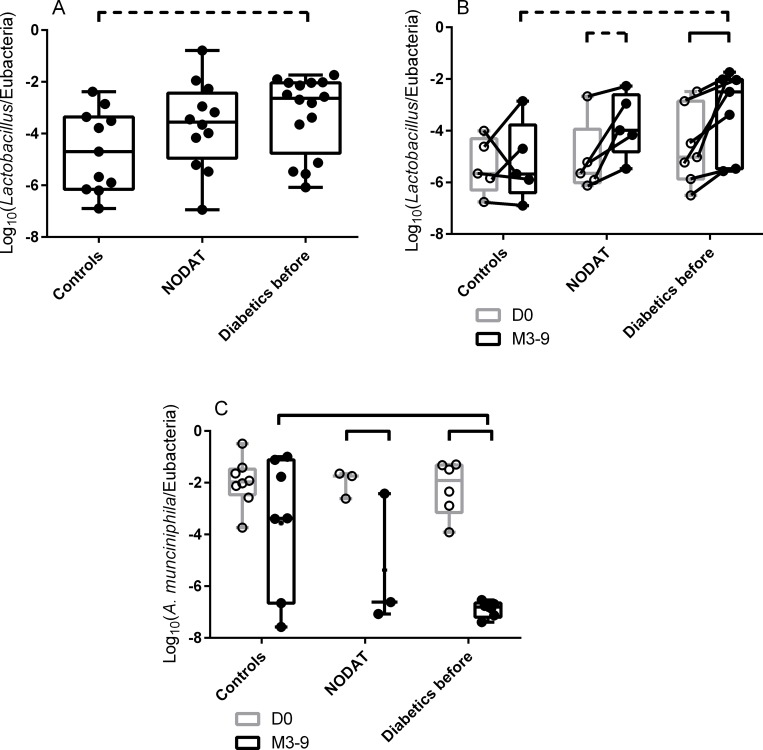
Fig 4. Quantification of specific fecal bacteria species 3 to 9 months after kidney transplantation.
A: Quantification of Lactobacilli in fecal samples collected 3–9 months after kidney transplantation. The relative abundance of Lactobacilli out of the total bacteria was higher in diabetic patients than in controls. NODAT patients had an intermediate proportion of Lactobacilli. B: Relative abundance of Lactobacilli in fecal samples collected at D0 and 3–9 months after kidney transplantation, restricted to carriers for whom a sample at D0 and 3–9 months after kidney transplantation was available (paired samples from the same patients before and after KT). The relative abundance of Lactobacilli tended to increase between D0 and M3-9 in NODAT patients and increased in patients who were diabetics before KT. Finally, the relative abundance of Lactobacilli tended to be higher in diabetic patients than in controls at M3-9. C: Relative abundance of Akkermansia muciniphila in fecal samples collected at D0 and 3–9 months after kidney transplantation. The relative abundance of A. muciniphila out of the total bacteria decreased between D0 and M3-9 in NODAT and diabetic patients. In addition, it was lower in diabetic patients than in controls at M3-9. Finally, NODAT patients had an intermediate relative abundance of A. muciniphila. Box (25th to 75th percentiles) and whiskers (min to max) with the median (line in the middle) and all individual values (rounds) are plotted. Bars at the top of graphs indicate significant differences. Dotted bars indicate trends (p≤0.08).

