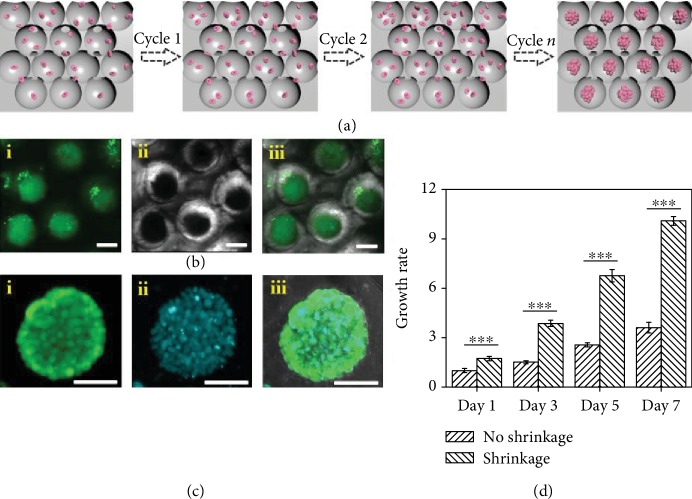
Figure 4.
The HepG2 spheroids. (a) The process of formation of HepG2 spheroids. (b) The following confocal images are the HepG2 spheroids stained with calcein AM (green) after 7 days of culture: (i) the fluorescent view, (ii) the bright field view, and (iii) the merged view. (c) The following confocal images are the HepG2 spheroids stained with calcein AM (green) (i) and DAPI (blue) (ii) after 7 days of culture and (iii) their merged view. (d) Cell growth rate of the spheroids by the shrinkage and no shrinkage methods; ∗∗∗p < 0.01. The scale bar is 100 μm.

