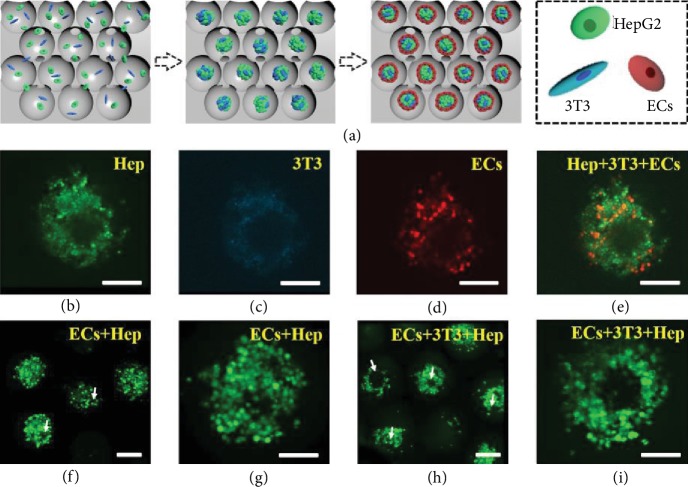
Figure 5.
Cell coculture system. (a) Schematic diagram of the cell coculture system. (b–e) The confocal images of the cell coculture system containing HepG2 (green), 3T3 (blue), and ECs (red) on day 7 of culture. (f–i) The confocal images of calcein-AM-stained ECs after coculture with HepG2 and both 3T3 and HepG2 for 7 days. White arrows indicate capillary-like structures. The scale bar is 100 μm.

