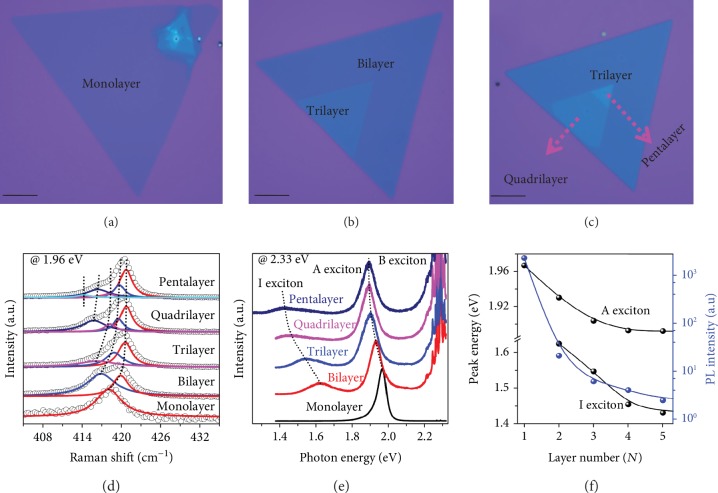
Figure 2.
Microscopy characterizations of 3R WS2 with distinct thicknesses. (a–c) Optical micrograph of representative 3R WS2 samples with different layers (1L-5L). Scale bar: 20 μm. (d) Raman spectra under 1.96 eV excitation, on resonance with the A exciton. Lorentzian fitting of the A1g(Γ) phonon modes is shown. (e) Normalized PL spectra by the intensity of the A exciton. The spectra were taken under the same conditions using 2.33 eV excitation. (f) Peak positions of excitons and integrated PL intensity as a function of layer numbers.

